Commentary from Our CIO—First Quarter 2021
First Quarter Market Recap
Global stock markets celebrated the one-year anniversary of the pandemic-induced bear market low (March 23, 2020) with another strong quarter of returns. The S&P 500 Index gained 6.3%, developed international stocks rose 4.5%, and emerging-market (EM) stocks gained 4.0%. 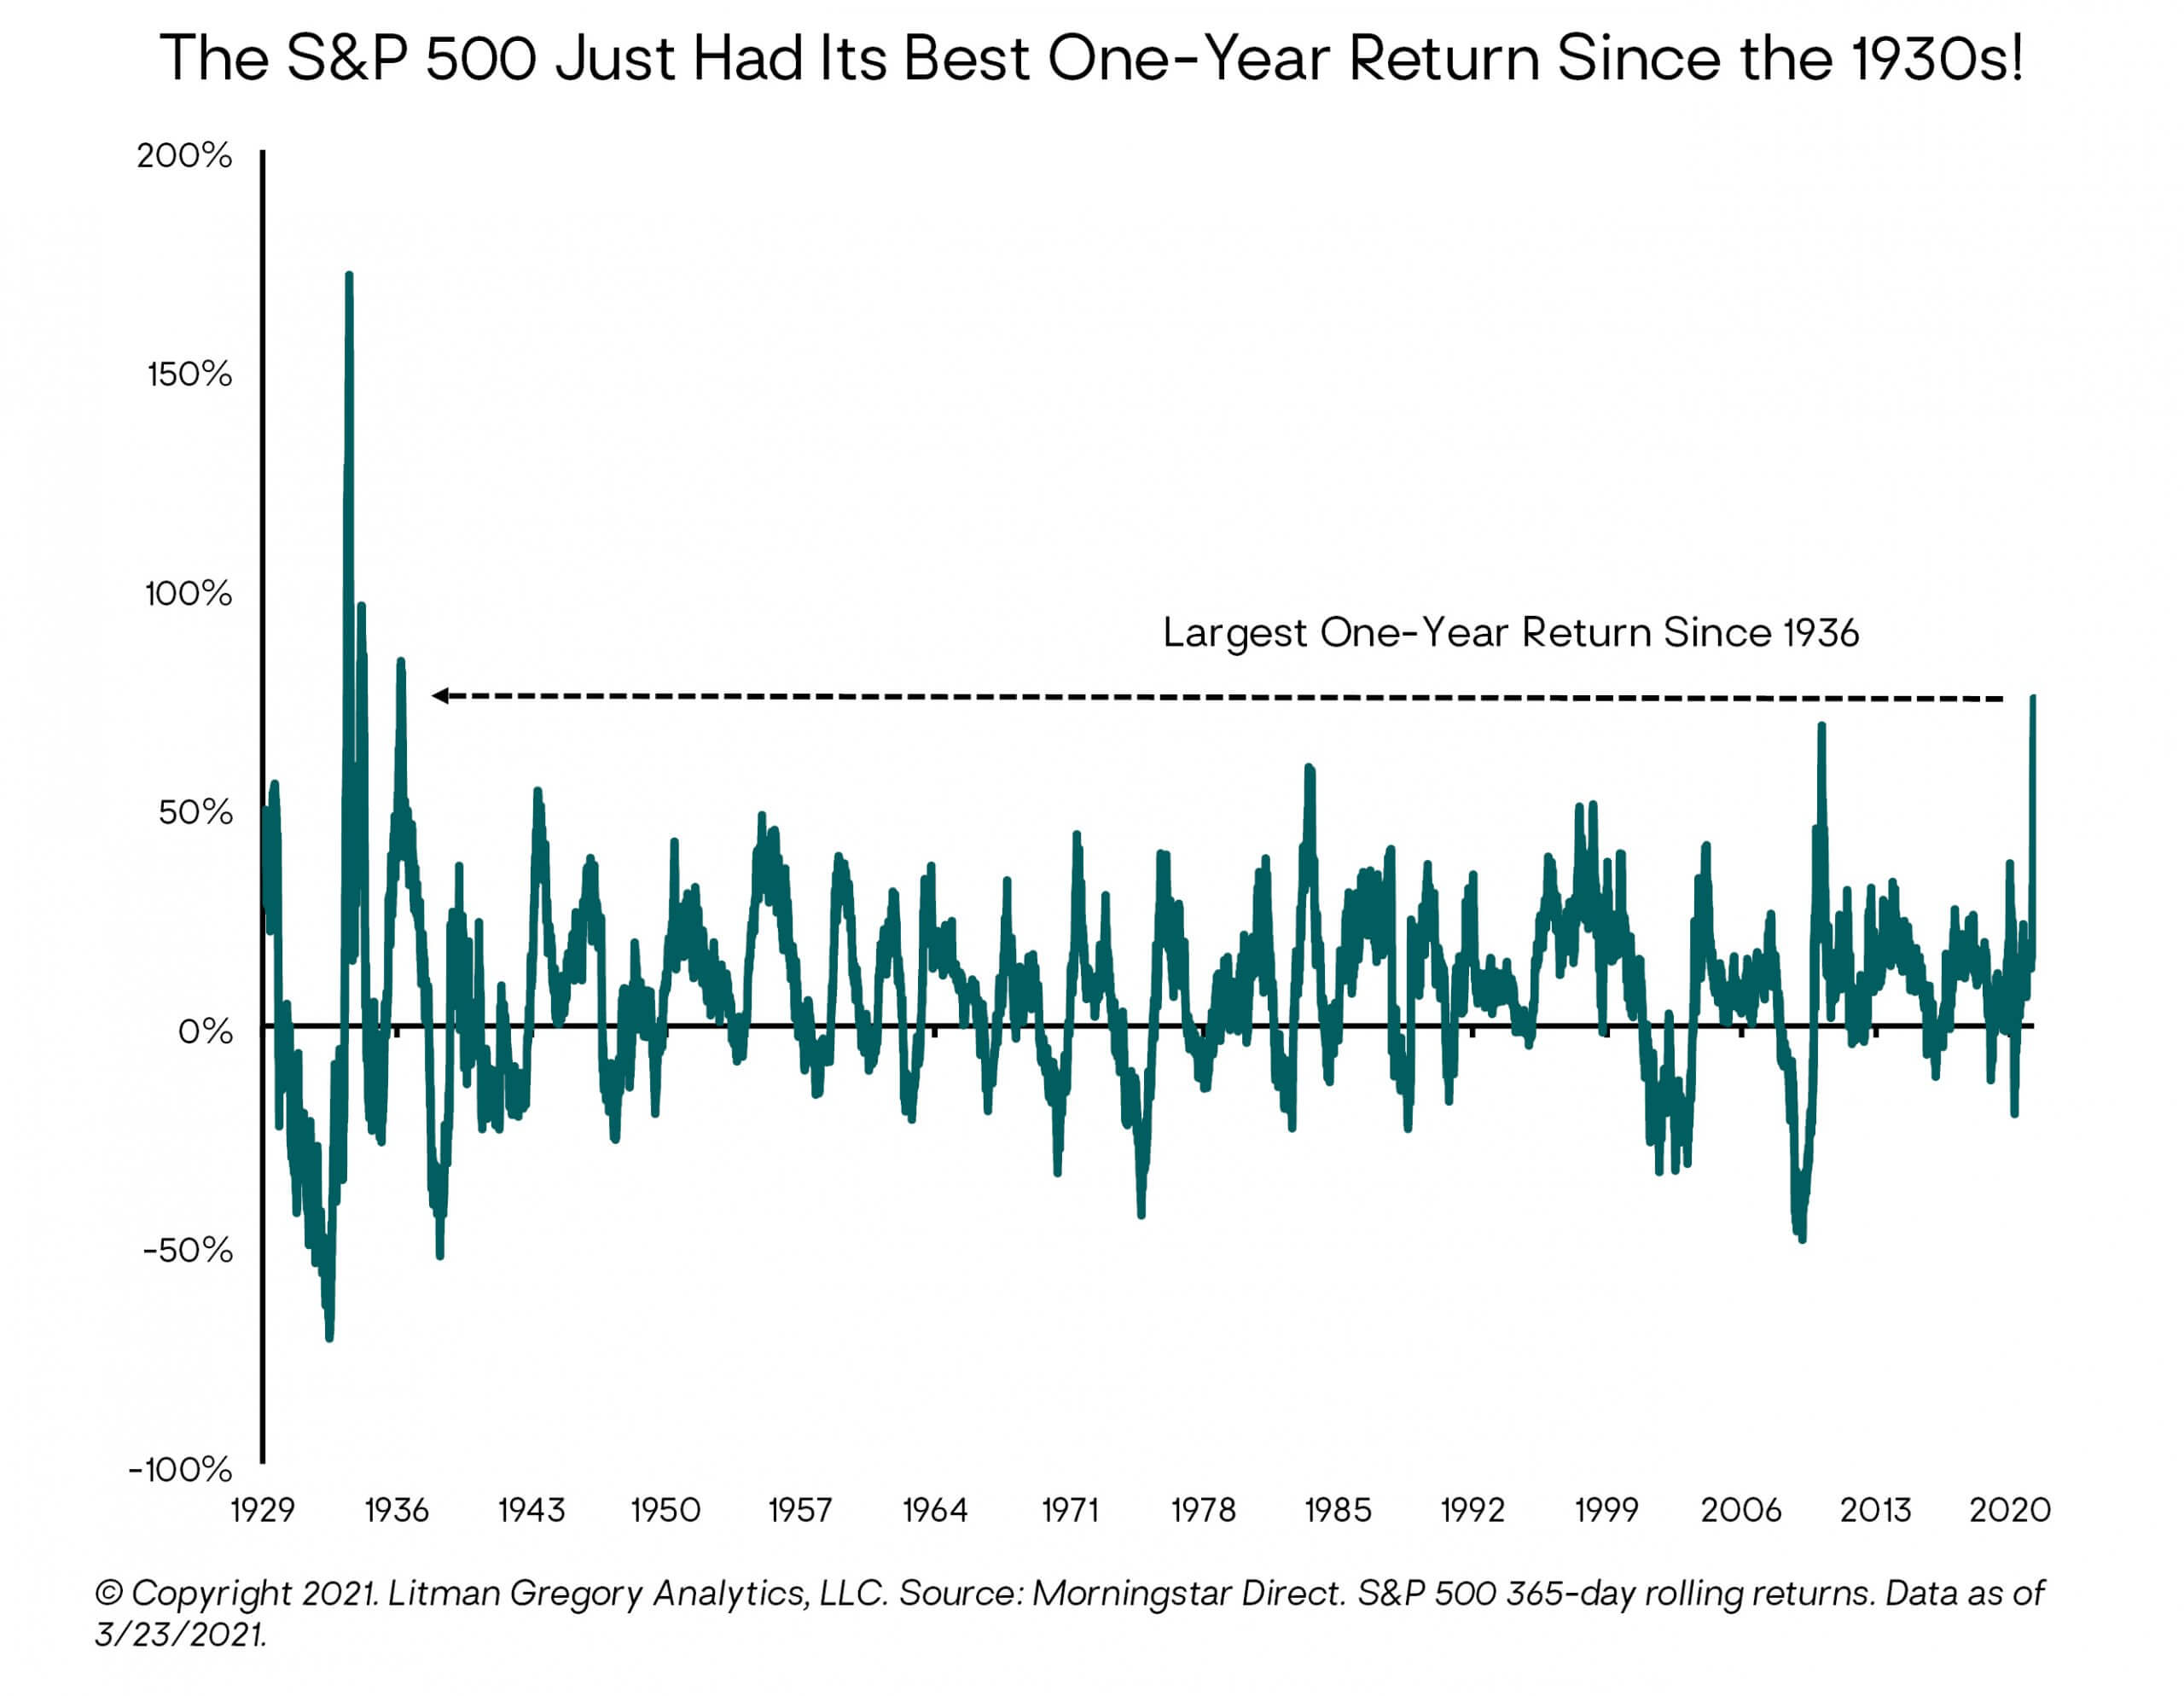
From the low on March 23, 2020, these benchmarks are up an astonishing 80.6%, 74.8%, and 74.6%, respectively. In fact, the S&P 500’s one-year return from the low was its best since 1936. Clearly, it paid not to panic and get out of the markets last spring, despite the natural fear, anxiety, and uncertainty everyone was feeling at the time.
The first quarter also saw a continuation of the “reflation rotation” trend that has been happening beneath the market surface over the past several months. Specifically, smaller-company stocks have trounced large caps, with the Russell 2000 Index gaining another 12.8% in the first quarter. And value stocks maintained their new-found edge over growth stocks: The Russell 1000 Value Index returned 11.4% versus 1.1% for its large-cap growth index counterpart. Meanwhile, the small-cap value index soared 21.3% for the quarter.
Looking at it from another perspective, cyclical (meaning more economically sensitive) stocks were the strongest performers. Energy and financials were the top-performing sectors in the S&P 500, gaining 30.9% and 16.0%, respectively. In contrast, utilities, consumer staples, and health care—considered “defensive” sectors—were among the worst, registering just slightly positive returns. The technology sector was also one of the bottom performers for the quarter.
As we will discuss in detail below, the reflationary winds tore through the fixed-income markets as well. The benchmark 10-year Treasury yield jumped nearly 75 basis points from year-end to close the quarter at 1.74%, a 14-month high. Correspondingly, the core bond index lost 3.6% for the quarter. This is its worst quarterly performance since 1981 and the fourth-worst return in the index’s history back to 1976. Core municipal bonds did better with a loss of 0.3% for the quarter.
On the flipside, floating-rate loans, which benefit from reflation, gained 1.8%. The high-yield bond index was up 0.9% for the quarter, while its yield dropped below 4% for the first time ever in February.
Finally, to the surprise of many in light of the reflationary/inflationary market mood, gold had a rough quarter, declining 10%. This is actually not that surprising in hindsight though, as the price of gold tends to be inversely correlated with real (inflation-adjusted) interest rates. Along with nominal bond yields, real yields also rose in the first quarter, with the 10-year TIPS yield increasing roughly 40 basis points from negative 1.0% to negative 0.6%. The U.S. dollar, which is also typically inversely correlated with the price of gold, halted its multi-month decline and posted a roughly 3% gain for the quarter (depending on which dollar index one uses).
Portfolio Performance & Key Performance Drivers
The broad reflationary market trends in the first quarter had a positive impact on our portfolios’ performance. Our underweight to core bonds in favor of floating-rate loans and actively managed, flexible fixed-income strategies added meaningful excess positive returns. Our positions in alternative strategies also outperformed core bonds by a wide margin. On the equity side, our overweight to EM stocks relative to U.S. stocks was slightly negative, as EM’s recent run of outperformance reversed late in the quarter. Our active EM fund managers in aggregate trailed the broad EM index. Our U.S. equity active manager performance was mixed relative to the market index, with some managers outperforming and others trailing for the quarter. As expected, most of our more value-oriented managers strongly outperformed.
The Macro Backdrop
Once again, we find it most useful to frame our discussion of the macroeconomic backdrop around the two key variables we have focused on since the COVID-19 pandemic began a year ago:
- The virus spread and severity; and
- The monetary and fiscal policy response
Both variables currently imply a positive base-case outlook for a strong economic recovery in the United States (and globally to varying degrees) this year. Looking further out, absent a COVID-19 resurgence or a negative geopolitical shock, the recovery is likely to continue for several years (albeit at a much slower pace) as a positive self-reinforcing economic cycle kicks in. A policy mistake (for example, premature monetary policy tightening or a policy-induced inflationary spiral) is a very low near-term risk but is at meaningful risk of triggering a recession in the outer years of our five-year tactical horizon.
COVID-19 Spread & Severity
Substantial progress on vaccines is reason for cautious optimism. Over the past two months, the United States has seen very sharp declines in daily new cases, current hospitalizations, and daily new deaths from COVID-19. Meanwhile, the rate of COVID-19 vaccinations has soared to 2.8 million per day; more than 93 million Americans (nearly 30% of the population) have now received at least one dose, including 51 million who have been fully vaccinated. At the current pace, experts estimate the United States could achieve herd immunity by late summer.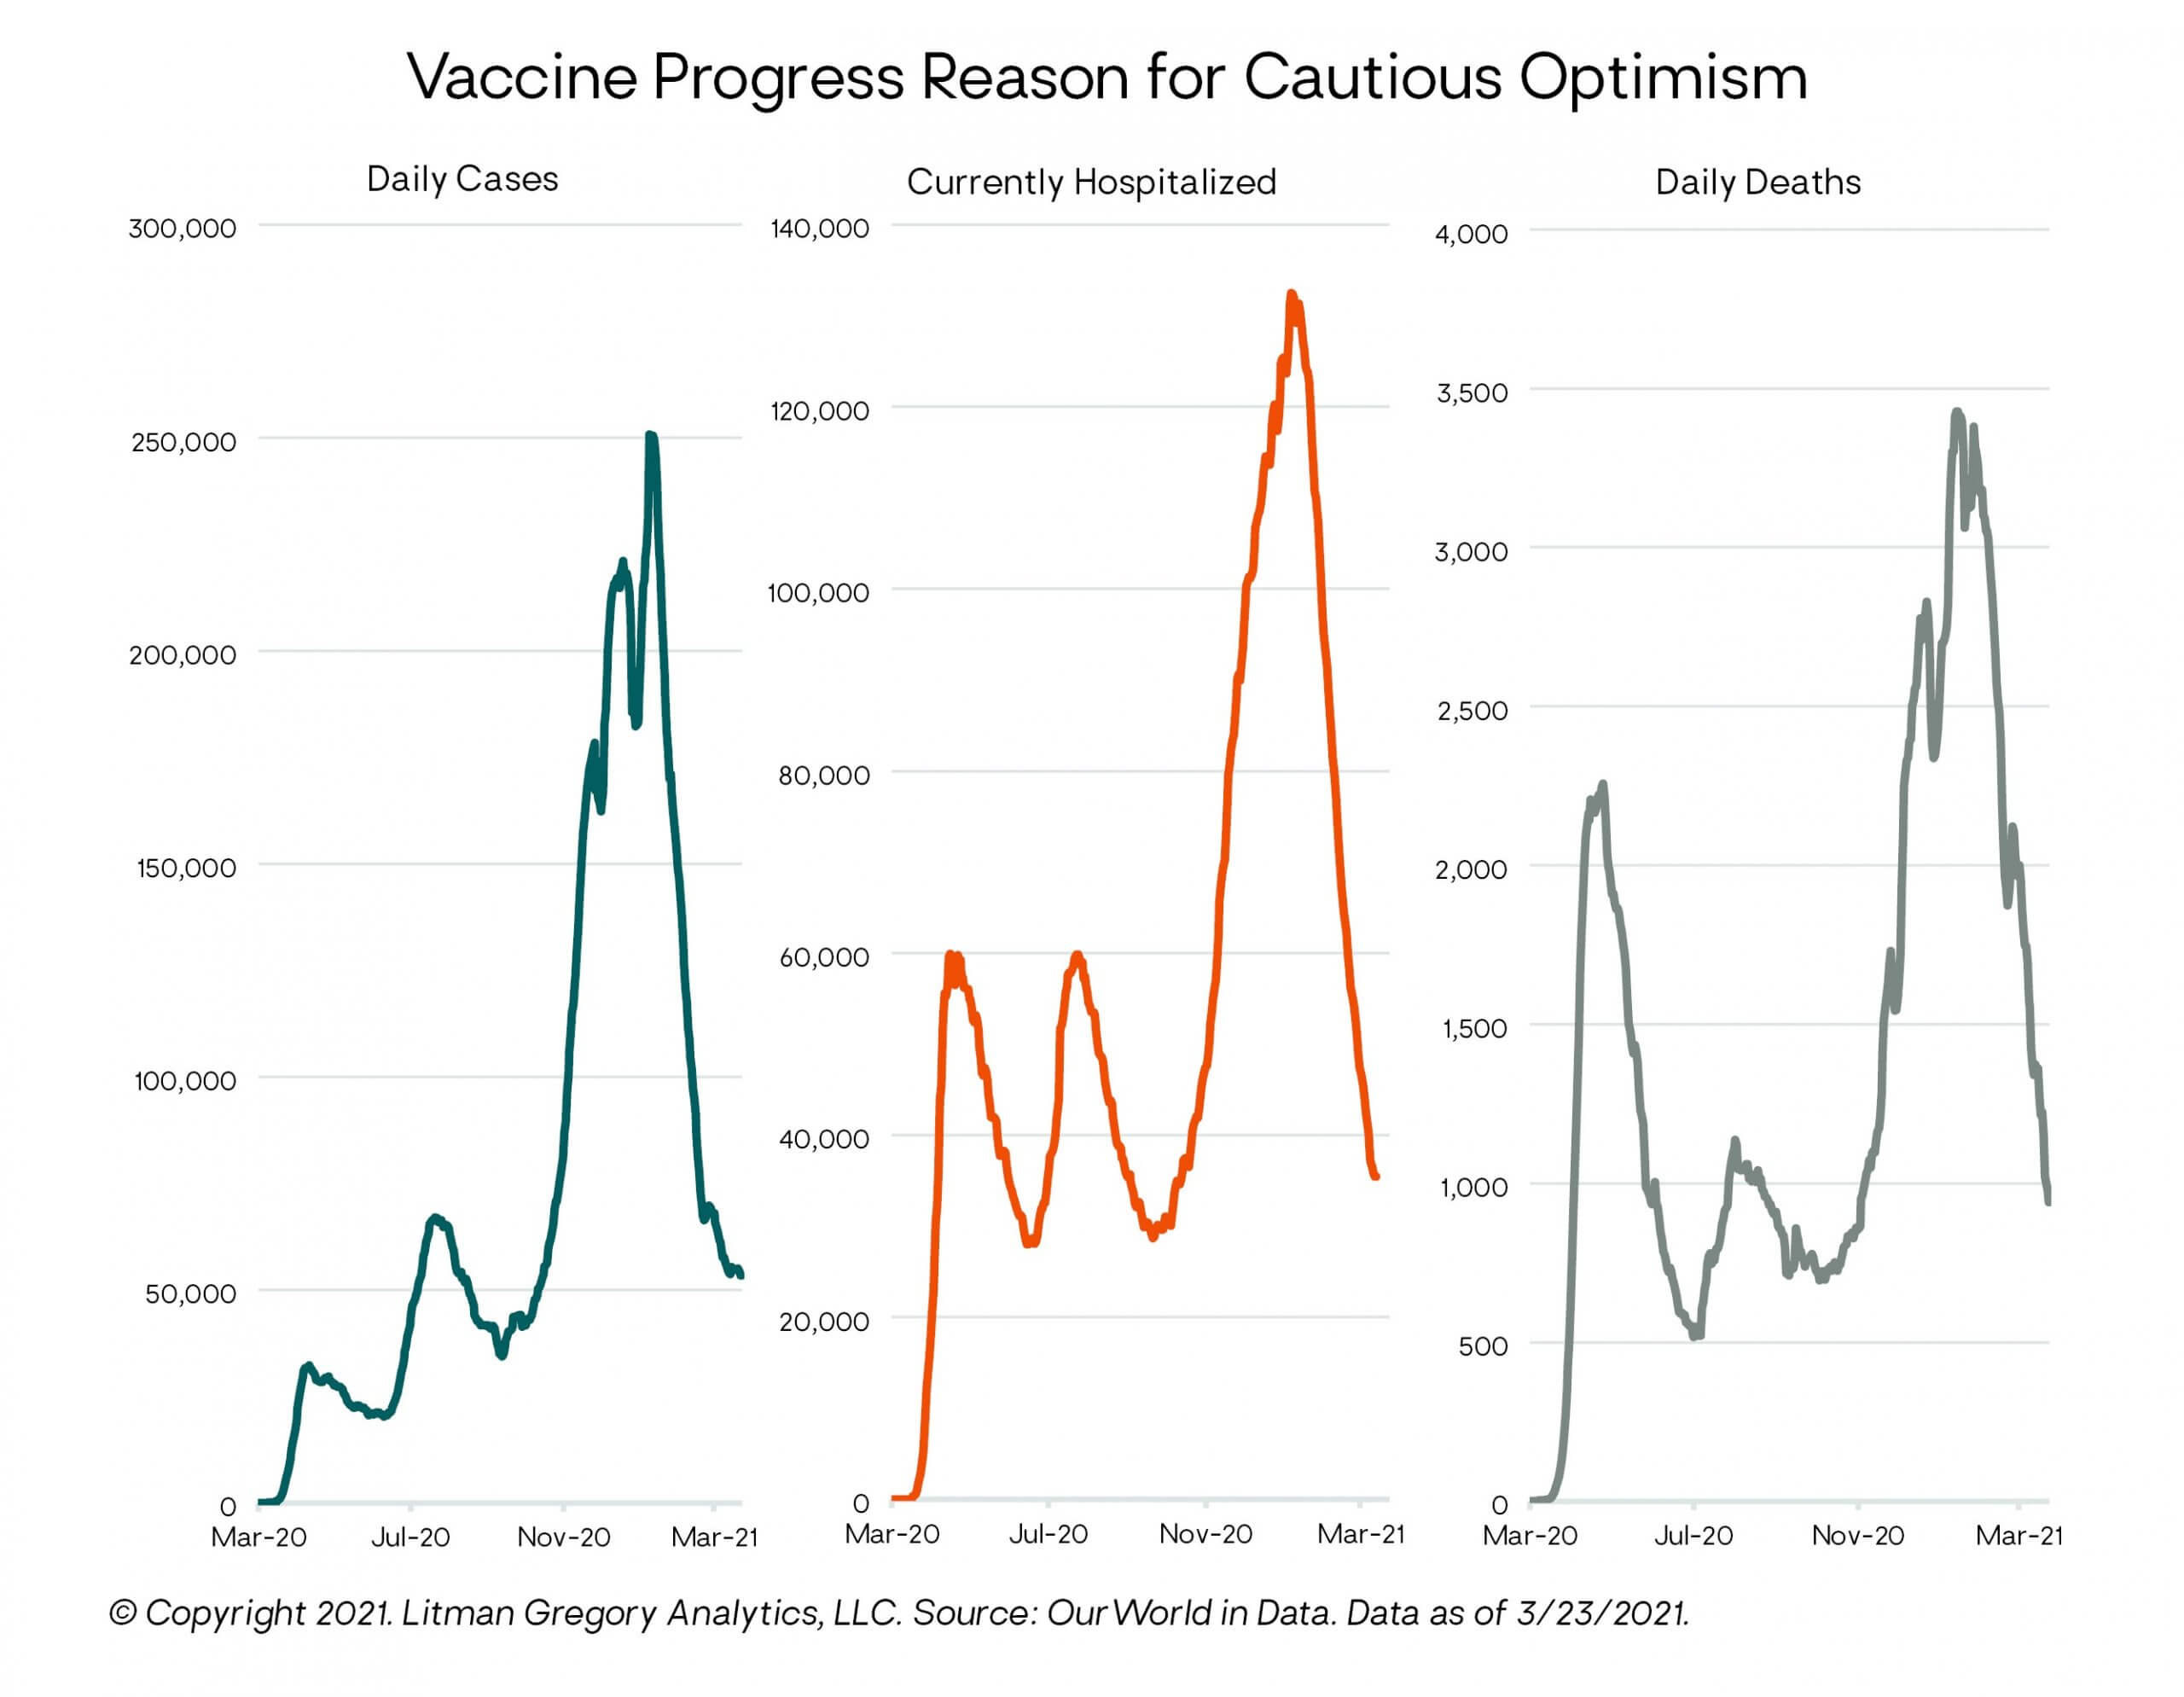
From an economic perspective, getting the pandemic under control will enable increased activity, employment, household income, consumer spending, economic growth, and corporate earnings.
Clearly, we are not out of the woods yet. There is increasing risk from the spread of new, more infectious variants, as is happening in several European countries leading to renewed lockdowns and fears of something similar playing out (with a lag) here. The United States could reopen local economies and/or relax social distancing and public health restrictions too quickly, leading to another virus surge. But overall, the light at the end of the pandemic tunnel certainly appears to be getting brighter (to use everyone’s favorite cliché).
Monetary & Fiscal Policy: Full Speed Ahead
U.S. monetary and fiscal policy are both highly supportive of an economic recovery.
Starting with monetary policy, at its recent Federal Open Market Committee (FOMC) meeting in mid-March, the Federal Reserve (Fed) reinforced its commitment to its new monetary policy framework (introduced last fall) and its highly accommodative current stance. Unlike in the past when the Fed would start raising interest rates to preempt higher inflation based on its forecasts, the Fed says it will now wait to see actual sustained core inflation readings above its 2% average inflation target (AIT) before starting to tighten.
Consistent with its new AIT framework, the Fed continues to emphasize it is seeking to achieve not just “full employment”—as measured by the headline unemployment rate—but a “broad-based and inclusive goal” of “maximum employment,” which puts additional focus on harder-hit segments of the labor force, such as minorities, women, and low-income workers. Fed governor Lael Brainard highlighted the influence of this new approach recently writing, “The assessment of shortfalls from broad-based and inclusive maximum employment will be a critical guidepost for monetary policy, alongside indicators of realized and expected inflation.”
After the March FOMC meeting, Fed chair Jerome Powell summed up the Fed’s current stance as follows: “The economy is a long way from our employment and inflation goals, and it is likely to take some time for substantial further progress to be achieved. We will continue to provide the economy the support that it needs for as long as it takes.”
As such, the Fed kept its policy interest rate (the federal funds rate) unchanged at near-zero percent and gave no indication it is planning a reduction (or tapering) any time soon in its $120 billion per month quantitative easing (QE) asset purchase program. Moreover, the median FOMC member (11 out of 18 members) still does not expect the Fed to even start raising rates until at least 2024.
This is despite the Fed sharply increasing its median forecast for 2021 U.S. GDP growth to 6.5%—driven by the accelerating vaccine rollout, declining virus spread, and the passage of the $1.9 trillion American Rescue Plan (ARP) in March. In contrast, at the Fed’s December FOMC meeting three months ago, its median 2021 GDP growth forecast was 4.2%.
The Fed’s latest forecast of the year-end unemployment rate dropped to 4.5%, compared to their prior forecast of 5.0%. (The headline unemployment rate currently stands at 6.0%.) Finally, the Fed increased its forecast of core inflation to 2.2% for 2021, from 1.8% previously. (Core Personal Consumption Expenditures (PCE) inflation is currently running at 1.4% year over year.)
The chart below shows the Fed’s current and prior economic and fed funds rate forecasts as well as its long-run “equilibrium” estimate for each variable. Note that after the upsurge in 2021, its forecasts for GDP growth and inflation drop back in line with its prior forecasts. We will discuss the inflation outlook and inflation risk in a separate section below. 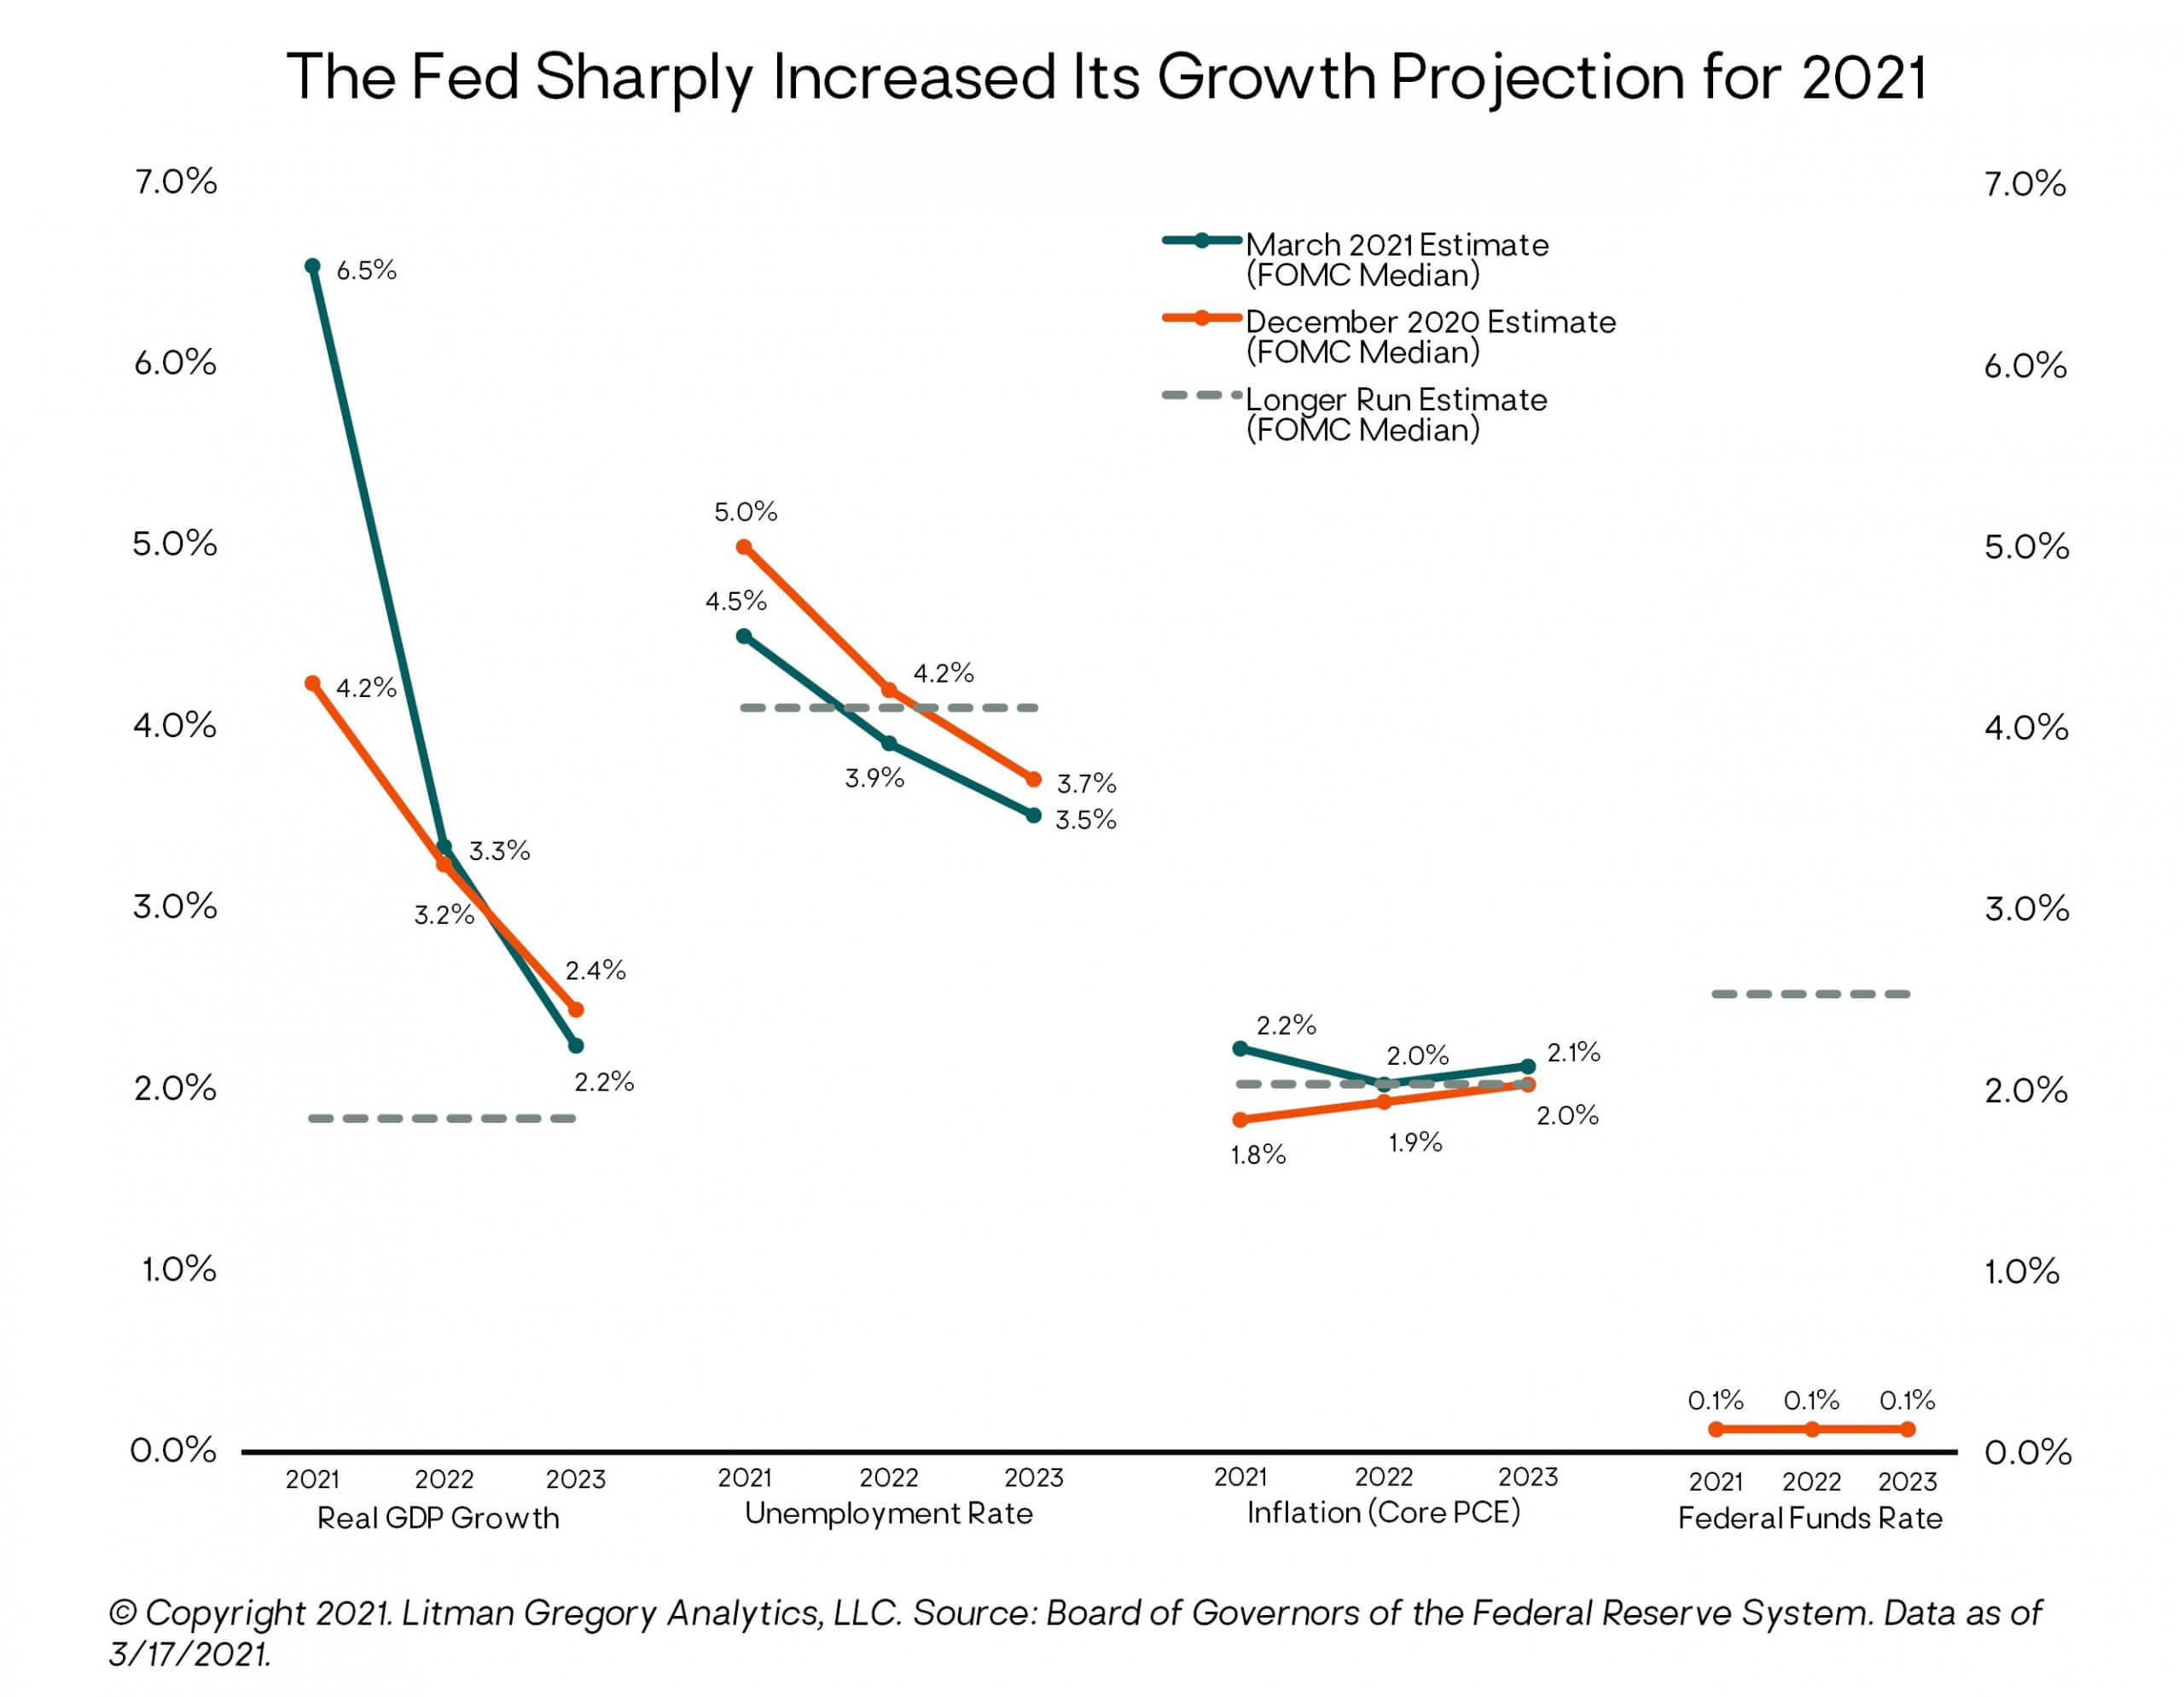
Moving to fiscal policy, the big news was the passage of the $1.9 trillion ARP, equivalent to roughly 9% of U.S. GDP. While most observers expected the Biden administration to enact a large fiscal package, many were surprised Congress passed the full $1.9 trillion initially proposed. Adding in the prior two pandemic-relief fiscal packages passed in March and December 2020, the total fiscal stimulus equates to more than 25% of GDP. This is a huge number and roughly five times the fiscal response during the 2008 Great Financial Crisis. It also contributed last year to the largest federal budget deficit since World War II, at 15% of GDP. The 2021 budget deficit is projected to be the second largest, at 10% of GDP.
Not all of the $1.9 trillion will be immediately spent; a meaningful portion of it will go into household savings and to pay down debt (and apparently, some to betting on Reddit stocks via Robinhood). According to Oxford Economics, Americans have accumulated $1.8 trillion in excess savings in the 11 months since the start of the pandemic. Oxford estimates this could rise to $2.5 trillion by this summer. That’s a lot of potential pent-up spending—more than 10% of GDP.
But the ARP should still produce a big short-term boost to GDP growth—and economists (as well as the Fed) have been revising up their 2021 forecasts accordingly.
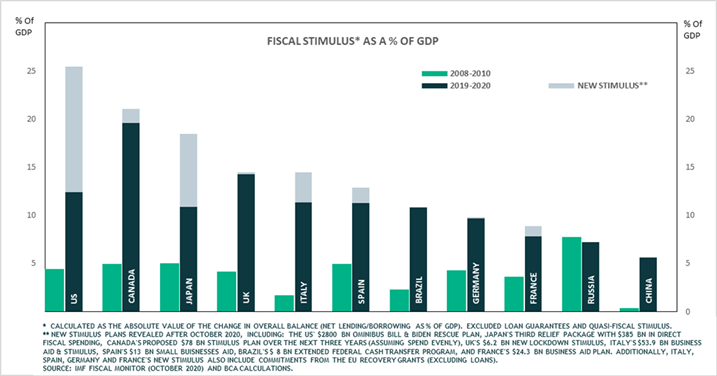
Source: BCA Research
However, the effect on GDP growth 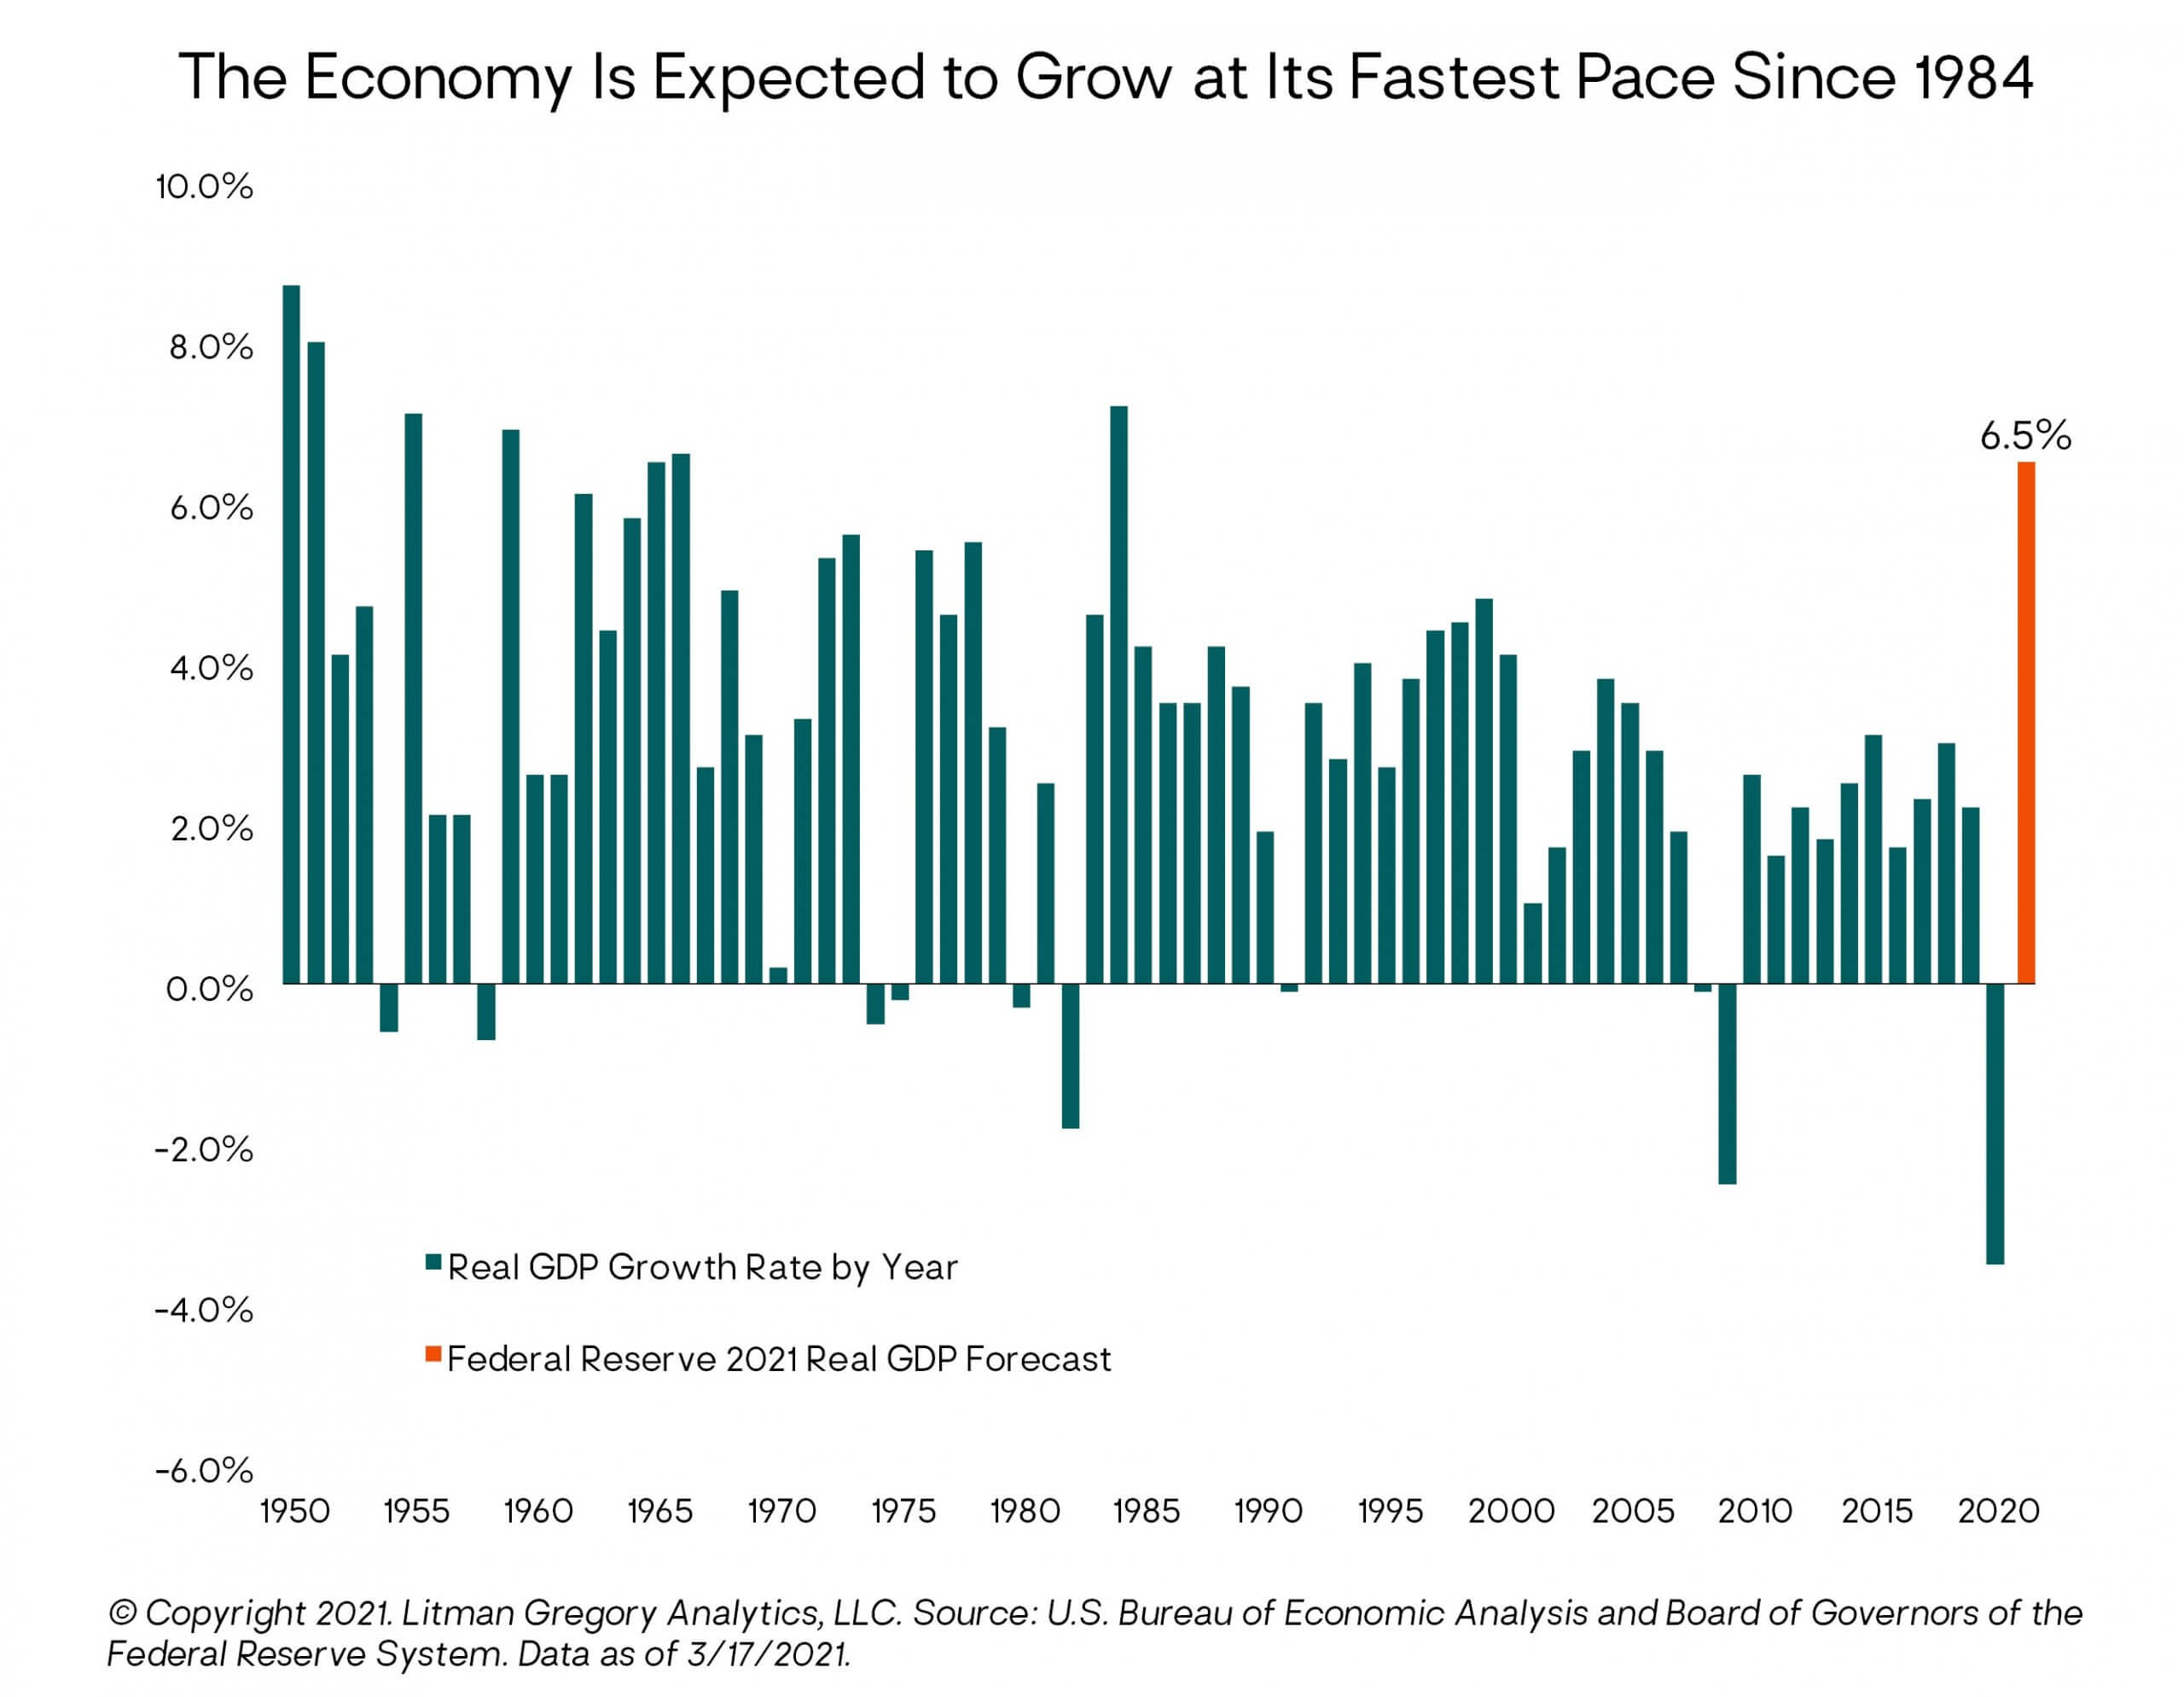 will be temporary as the relief programs are set to expire later this year. Without additional stimulus, the positive fiscal growth impulse this year will turn into a fiscal drag next year—what some are calling a “fiscal cliff.”
But if the Fed and Wall Street consensus GDP forecasts are at all in the ballpark (and yes, that’s a big if), the U.S. economy in 2021 will generate its strongest real GDP growth in 37 years (albeit coming off its deepest recession since the 1930s). 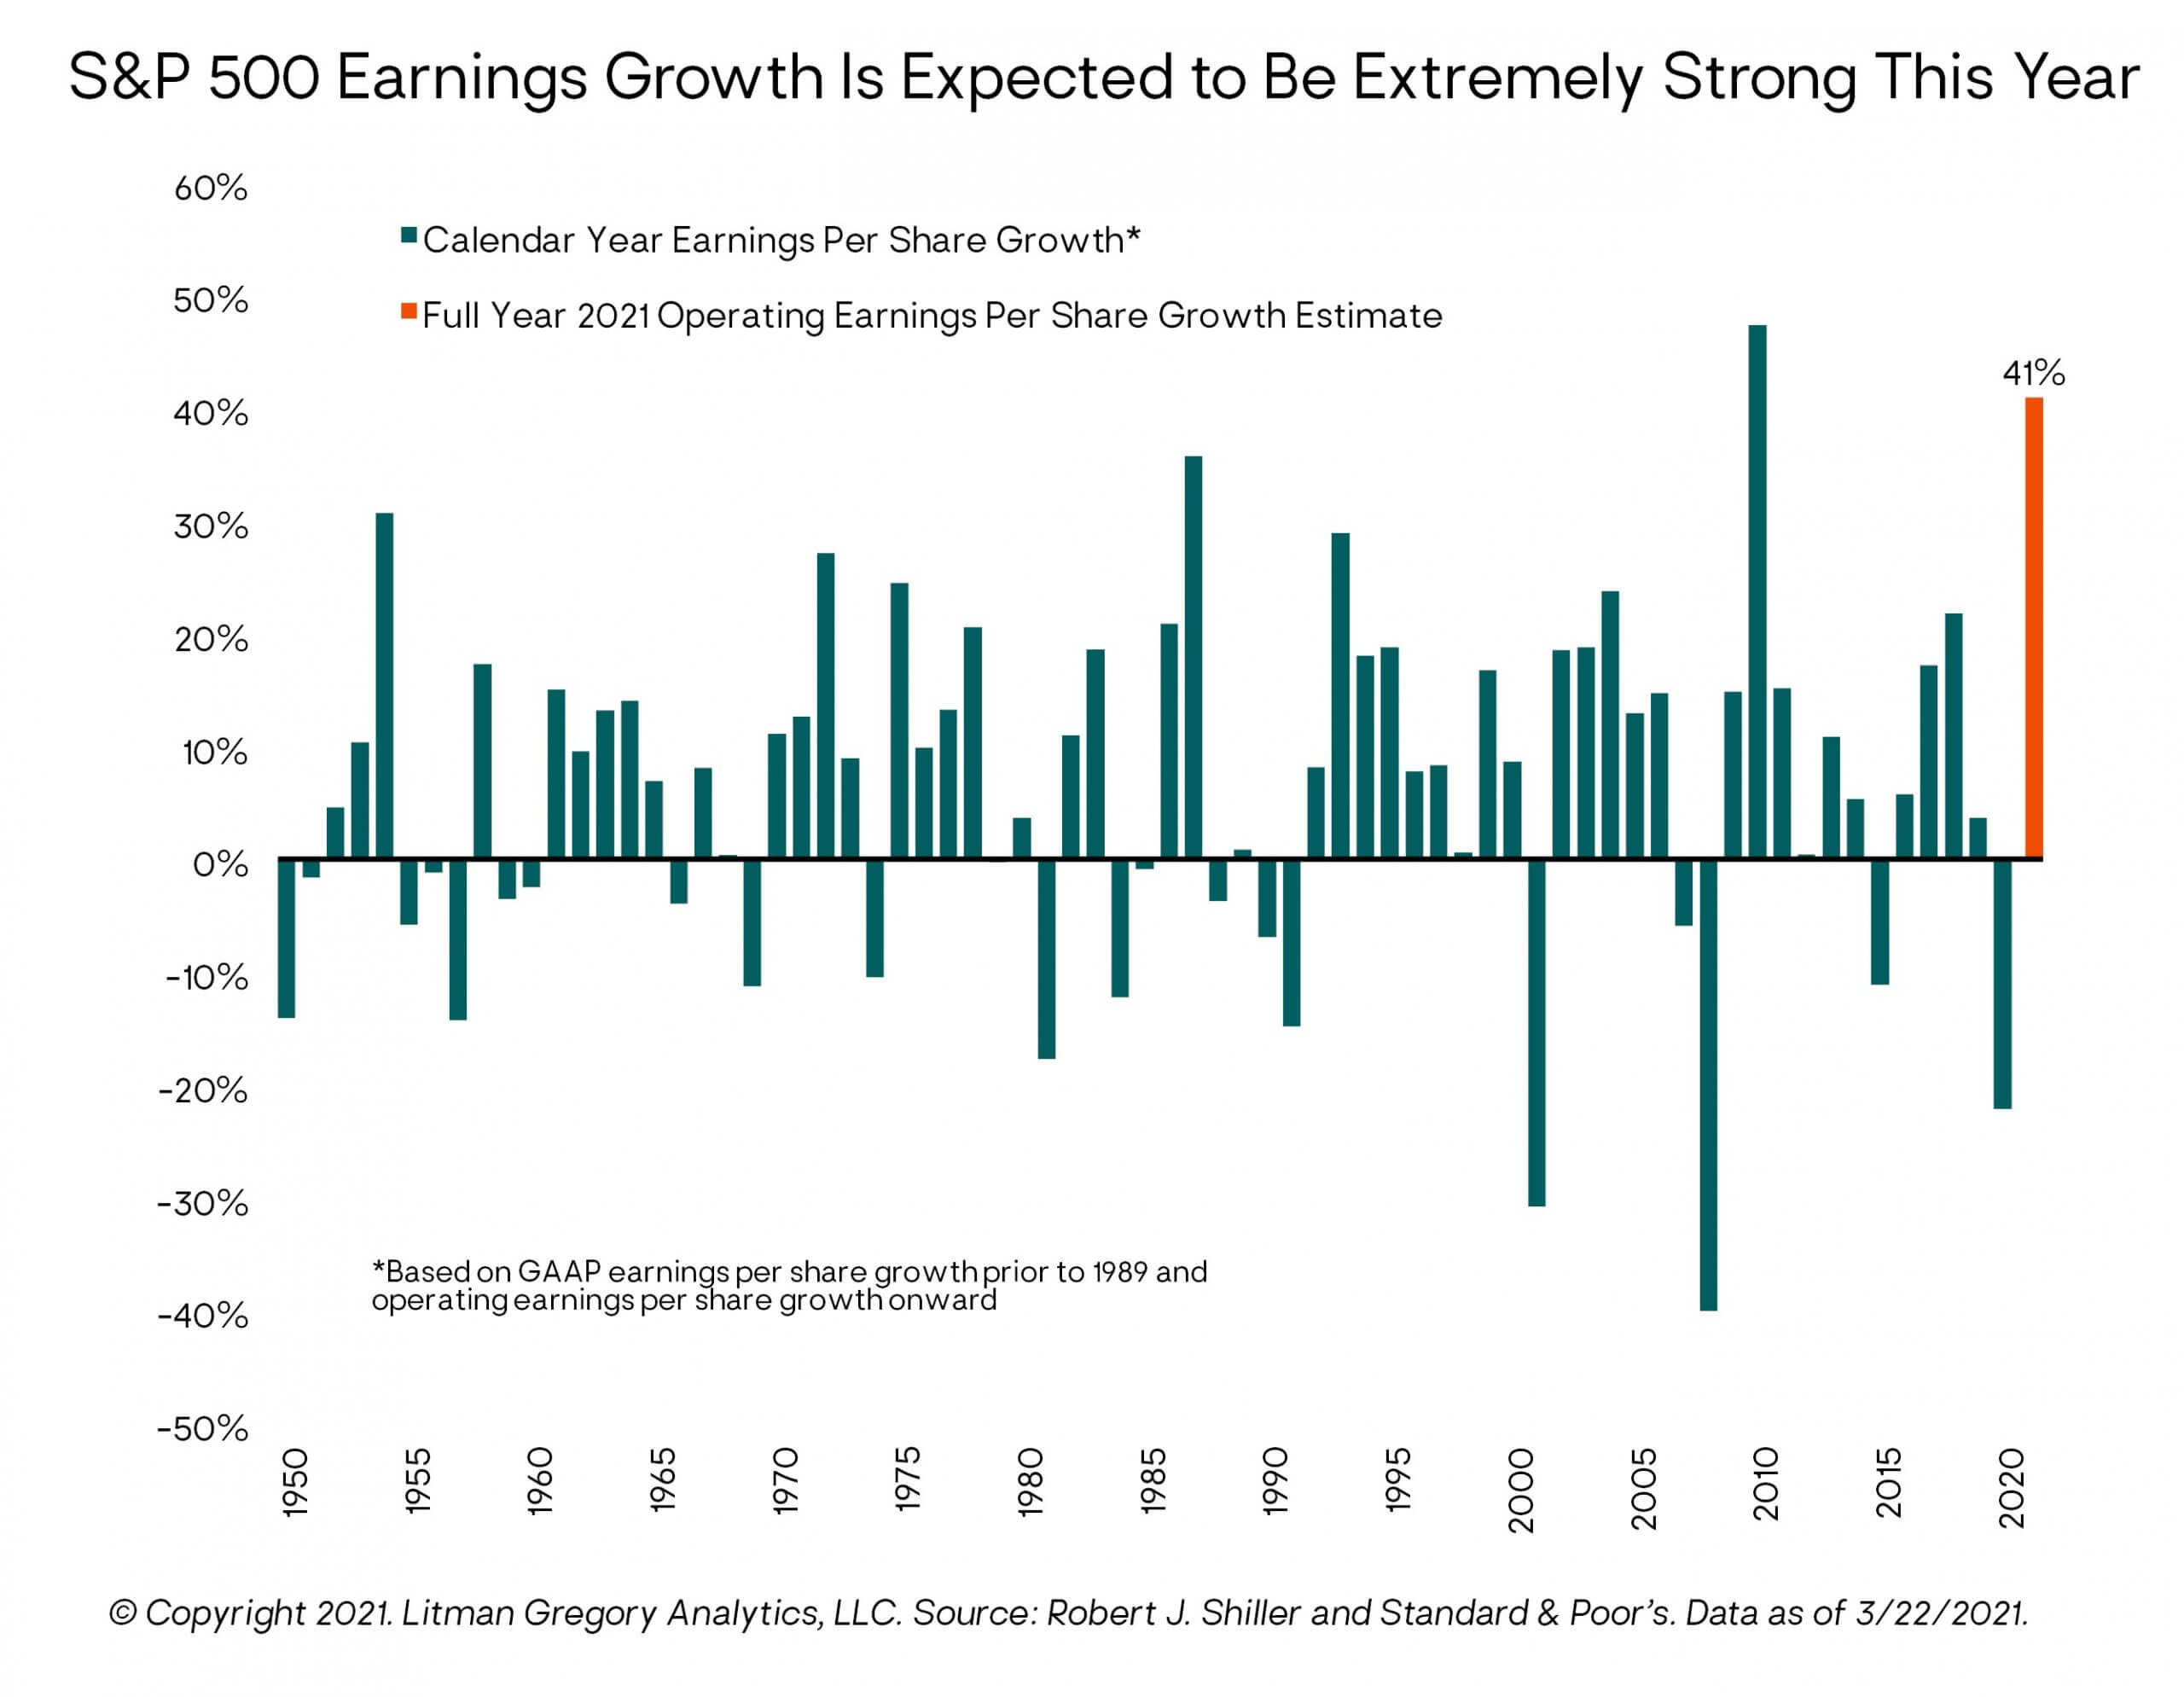
The Wall Street consensus is also expecting extremely strong corporate earnings growth in 2021, as shown in the chart below. S&P 500 Index operating earnings per share (EPS) are forecast to increase 41% this year, which would be the second-highest EPS growth rate in over 70 years. (The highest was in 2010, at 47%.)
What About Inflation?
Before turning to our outlook for the financial markets, we’d like to spend a bit more time on what we view as the key economic risk over the next several years: inflation.
Apparently, we are not alone in our focus on this topic (see the chart below, web searches for inflation have spiked).
Part of us would be satisfied summing up the debate on inflation with the words of the great investor Howard Marks, who recently wrote, “Is inflation a threat anytime soon? The answer’s clear: who knows?”
But while we all know that to be true—nobody knows what the future will bring, not even economists or highly paid Wall Street strategists!—we understand most readers are probably interested in a bit more detail than that. So, we will briefly lay out the main arguments on both sides of the inflation coin (no, we don’t mean Bitcoin) and where our view currently leans as reflected in our portfolio positioning. We will of course continue to update our inflation view as new information, data, and events unfold. 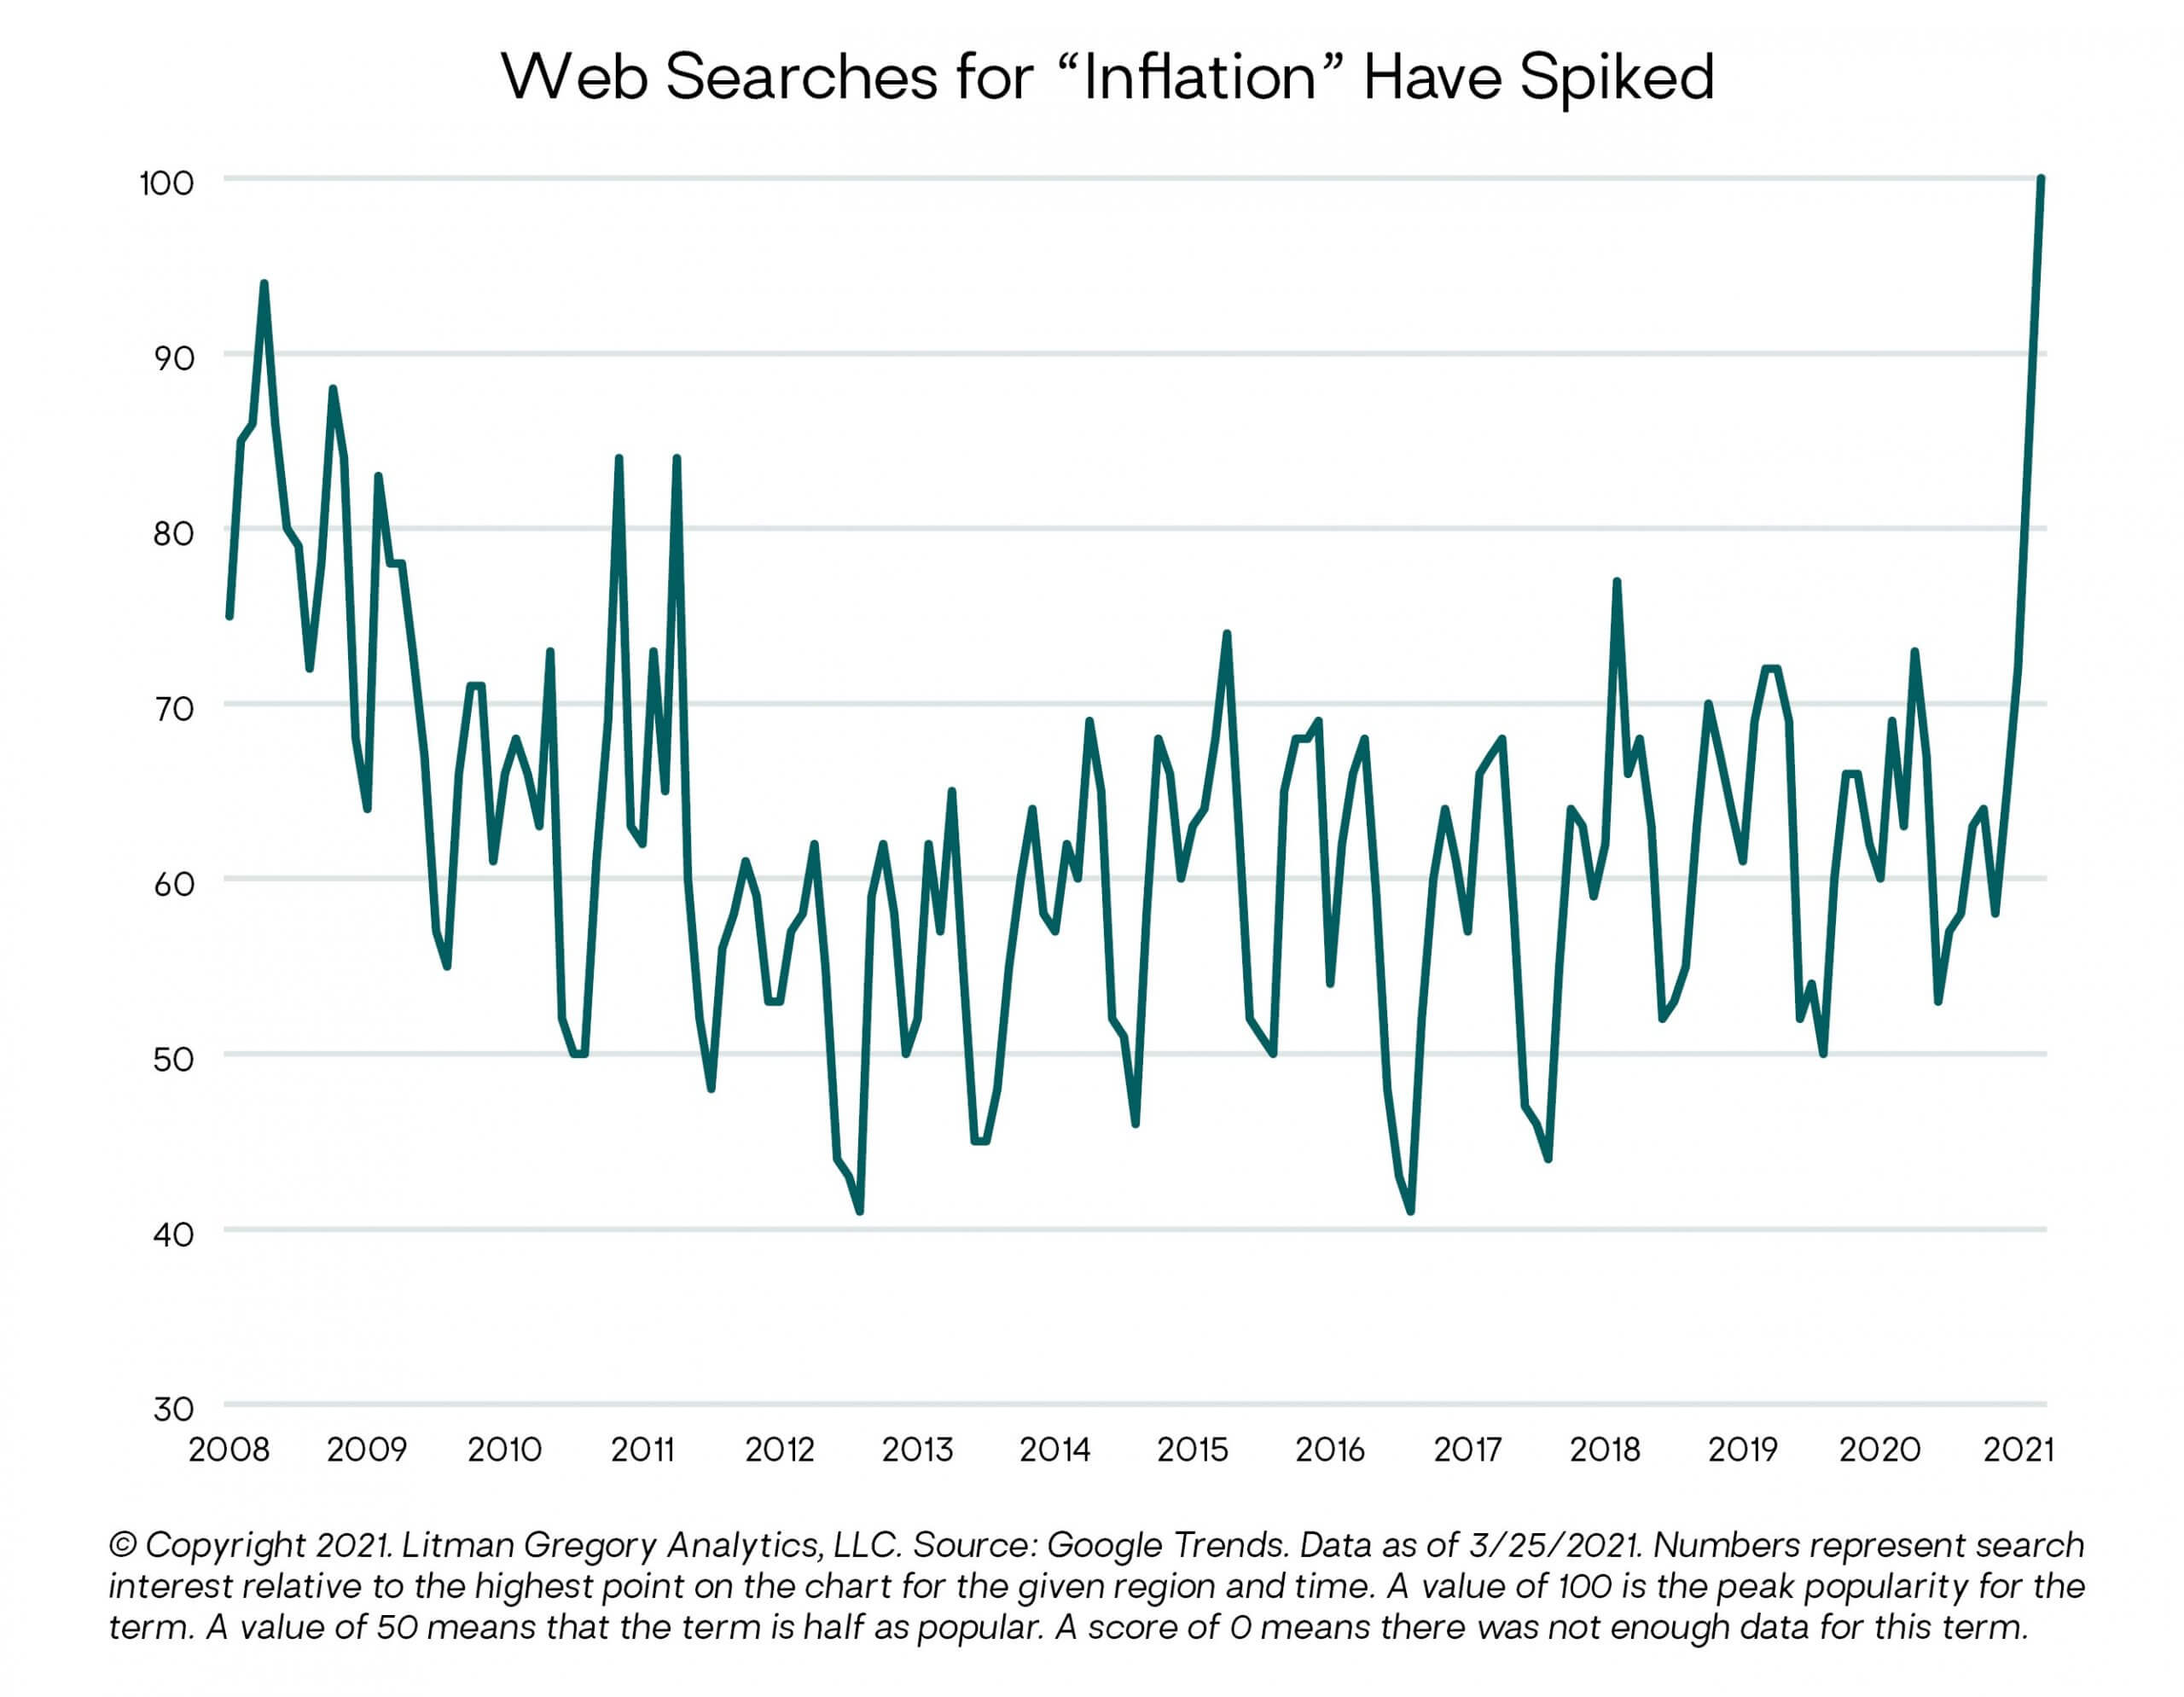
First, in a sense, inflation is more of a risk now because it has been so immaterial for most of the past 20 years. This has led policymakers, consumers, businesses, and investors to become complacent about it (at least up until very recently), as reflected in very low interest rates and bond yields, and very high stock market valuations.
The primary catalyst for the recent sharp uptick in inflation fears is the combination of the positive macro factors we discussed above: (1) the expected reopening of the economy as the pandemic is brought under control, (2) ongoing highly accommodative monetary policy, and (3) unprecedented fiscal stimulus/support and the prospect for more to come from the new administration and Congress. 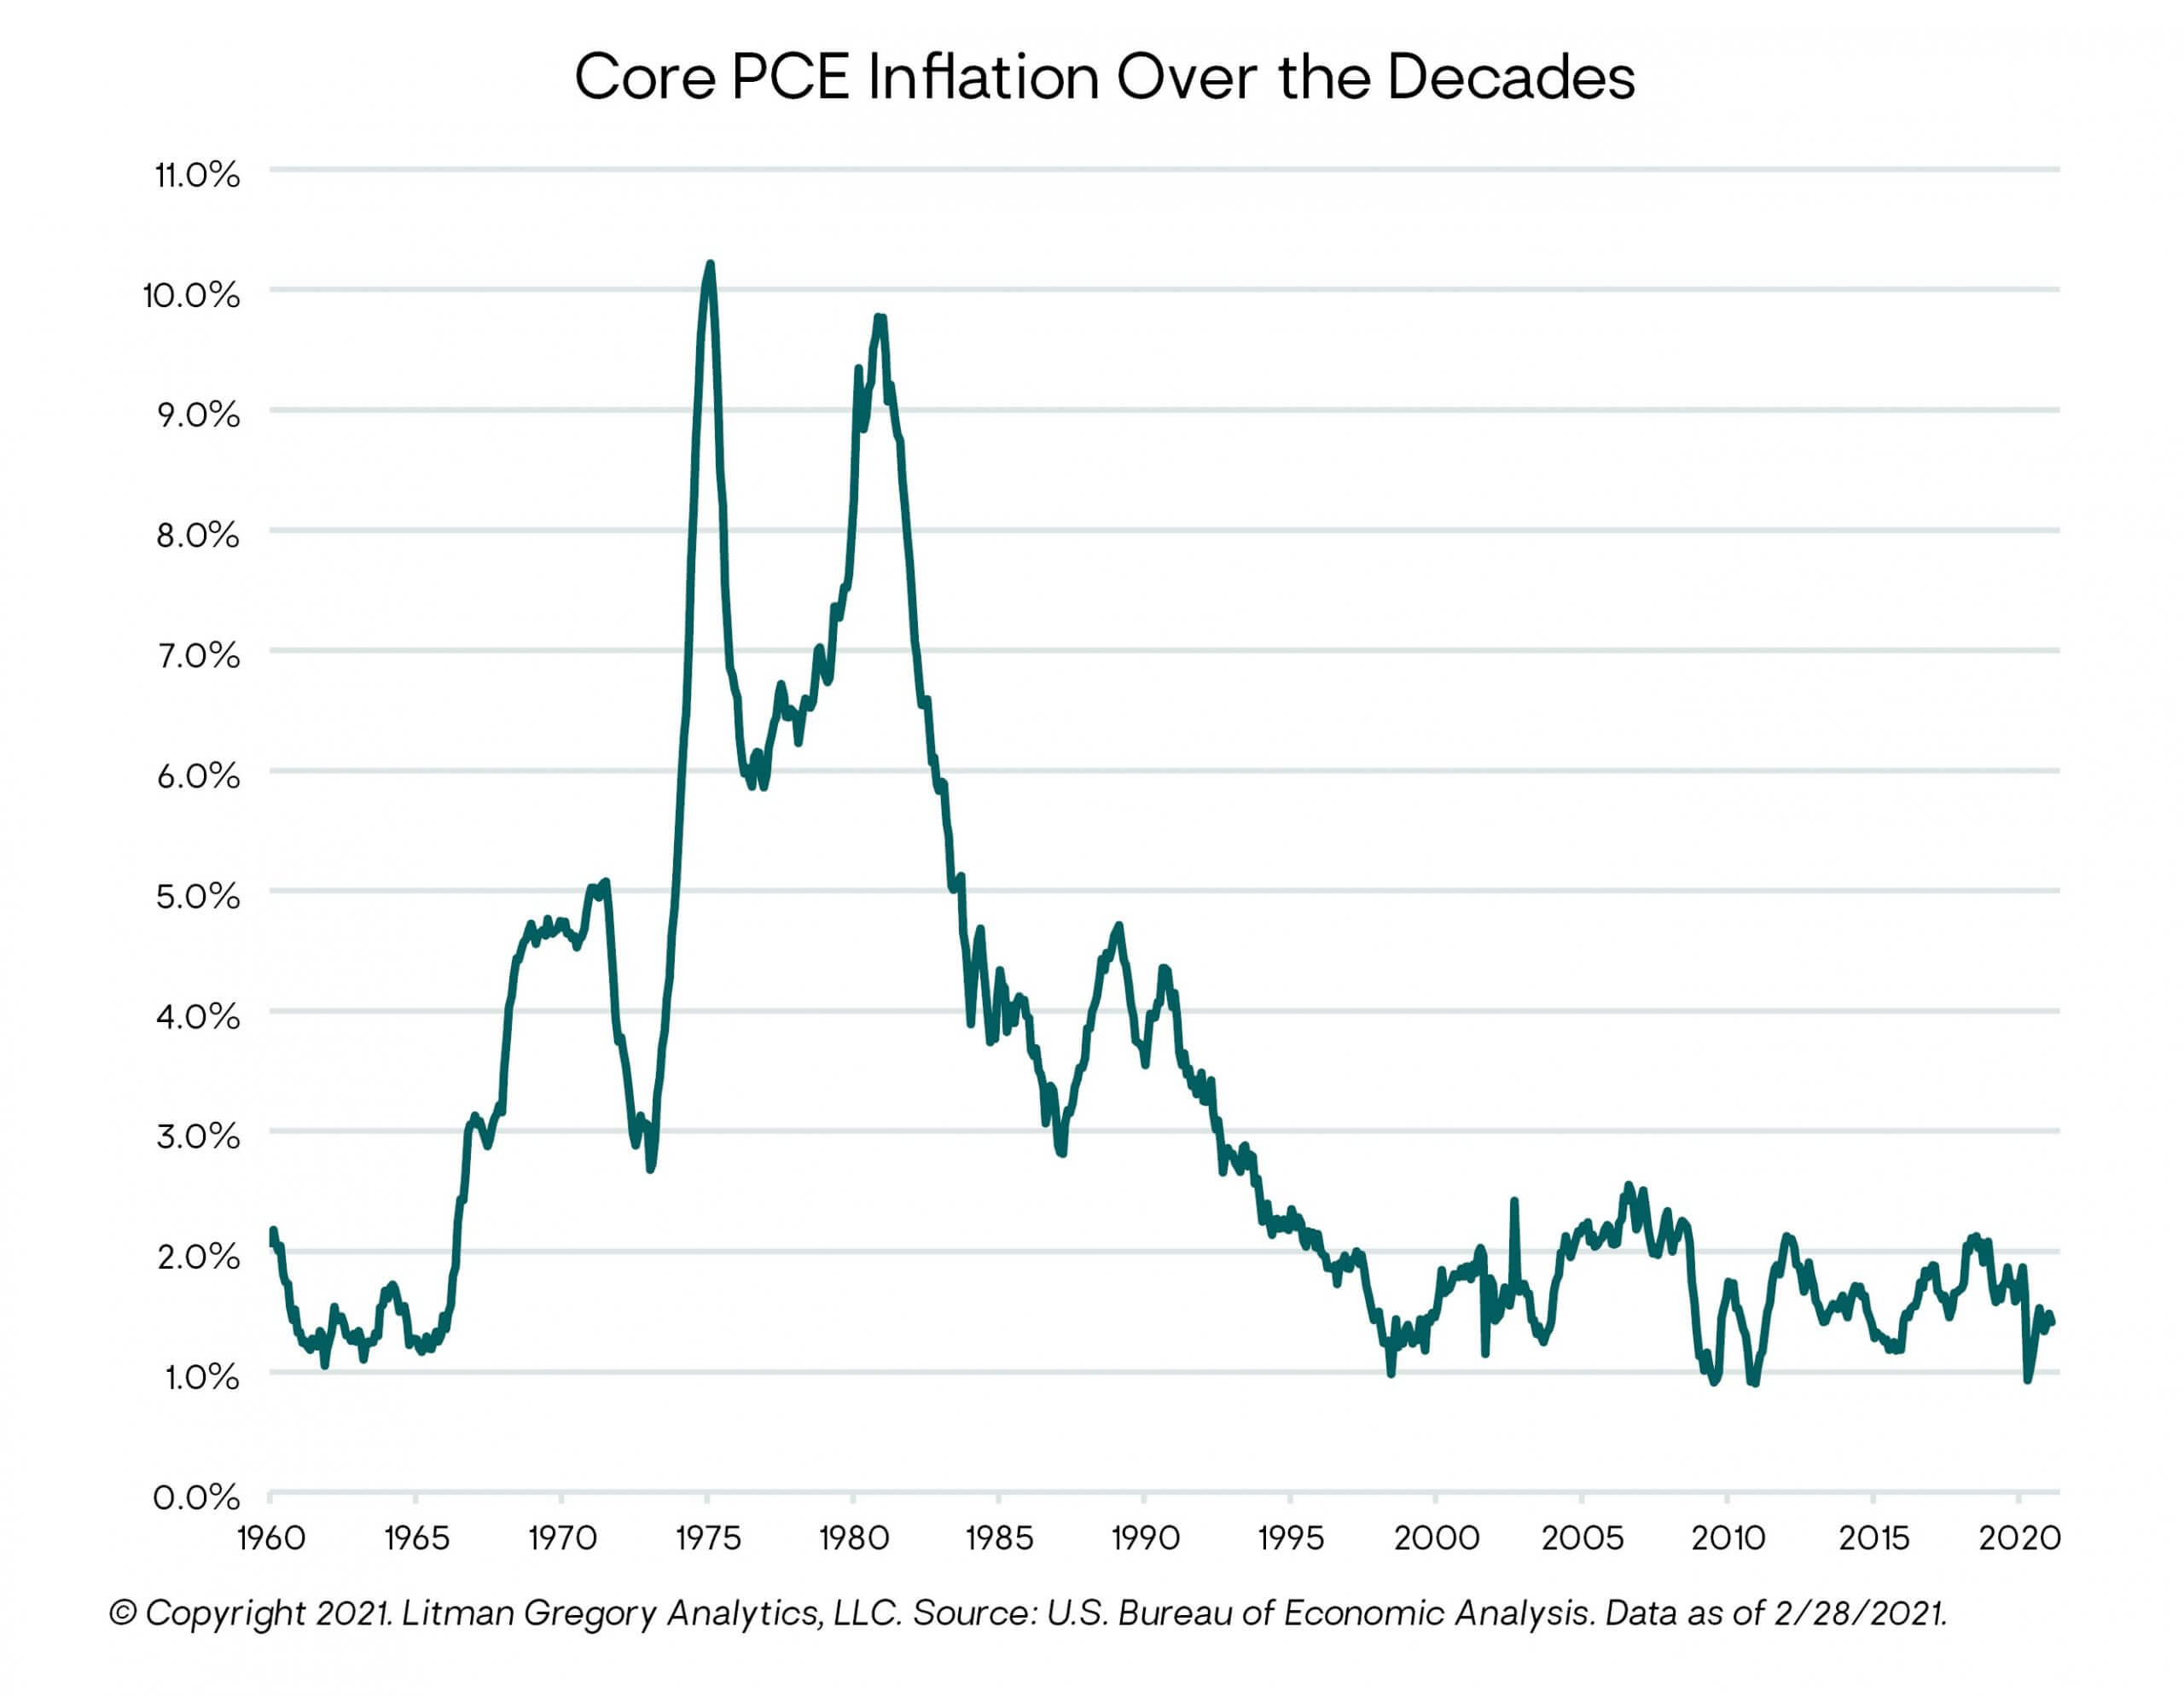
Market-based measures of short- to medium-term inflation expectations have shot up since year-end. For example, as shown in the chart below, the five-year “breakeven inflation rate” (the difference between the five-year nominal Treasury yield and the five-year inflation-protected Treasury, or TIPS, yield) hit a 13-year high recently, at just above 2.5%. The 10-year inflation breakeven is around 2.3%, a seven-year high.
Inflation expectations can be a key driver of actual inflation. If people act on their belief that future inflation will be higher, it can lead to a self-fulfilling cycle of actual higher inflation. Consumers pull forward their spending to buy while prices are (expected to be) lower, businesses do the same and may also raise prices to maintain profit margins, workers demand higher wages to compensate for higher inflation, businesses raise prices further to offset their higher input costs, inflation readings increase leading to expectations of yet more inflation coming down the pike, etc. 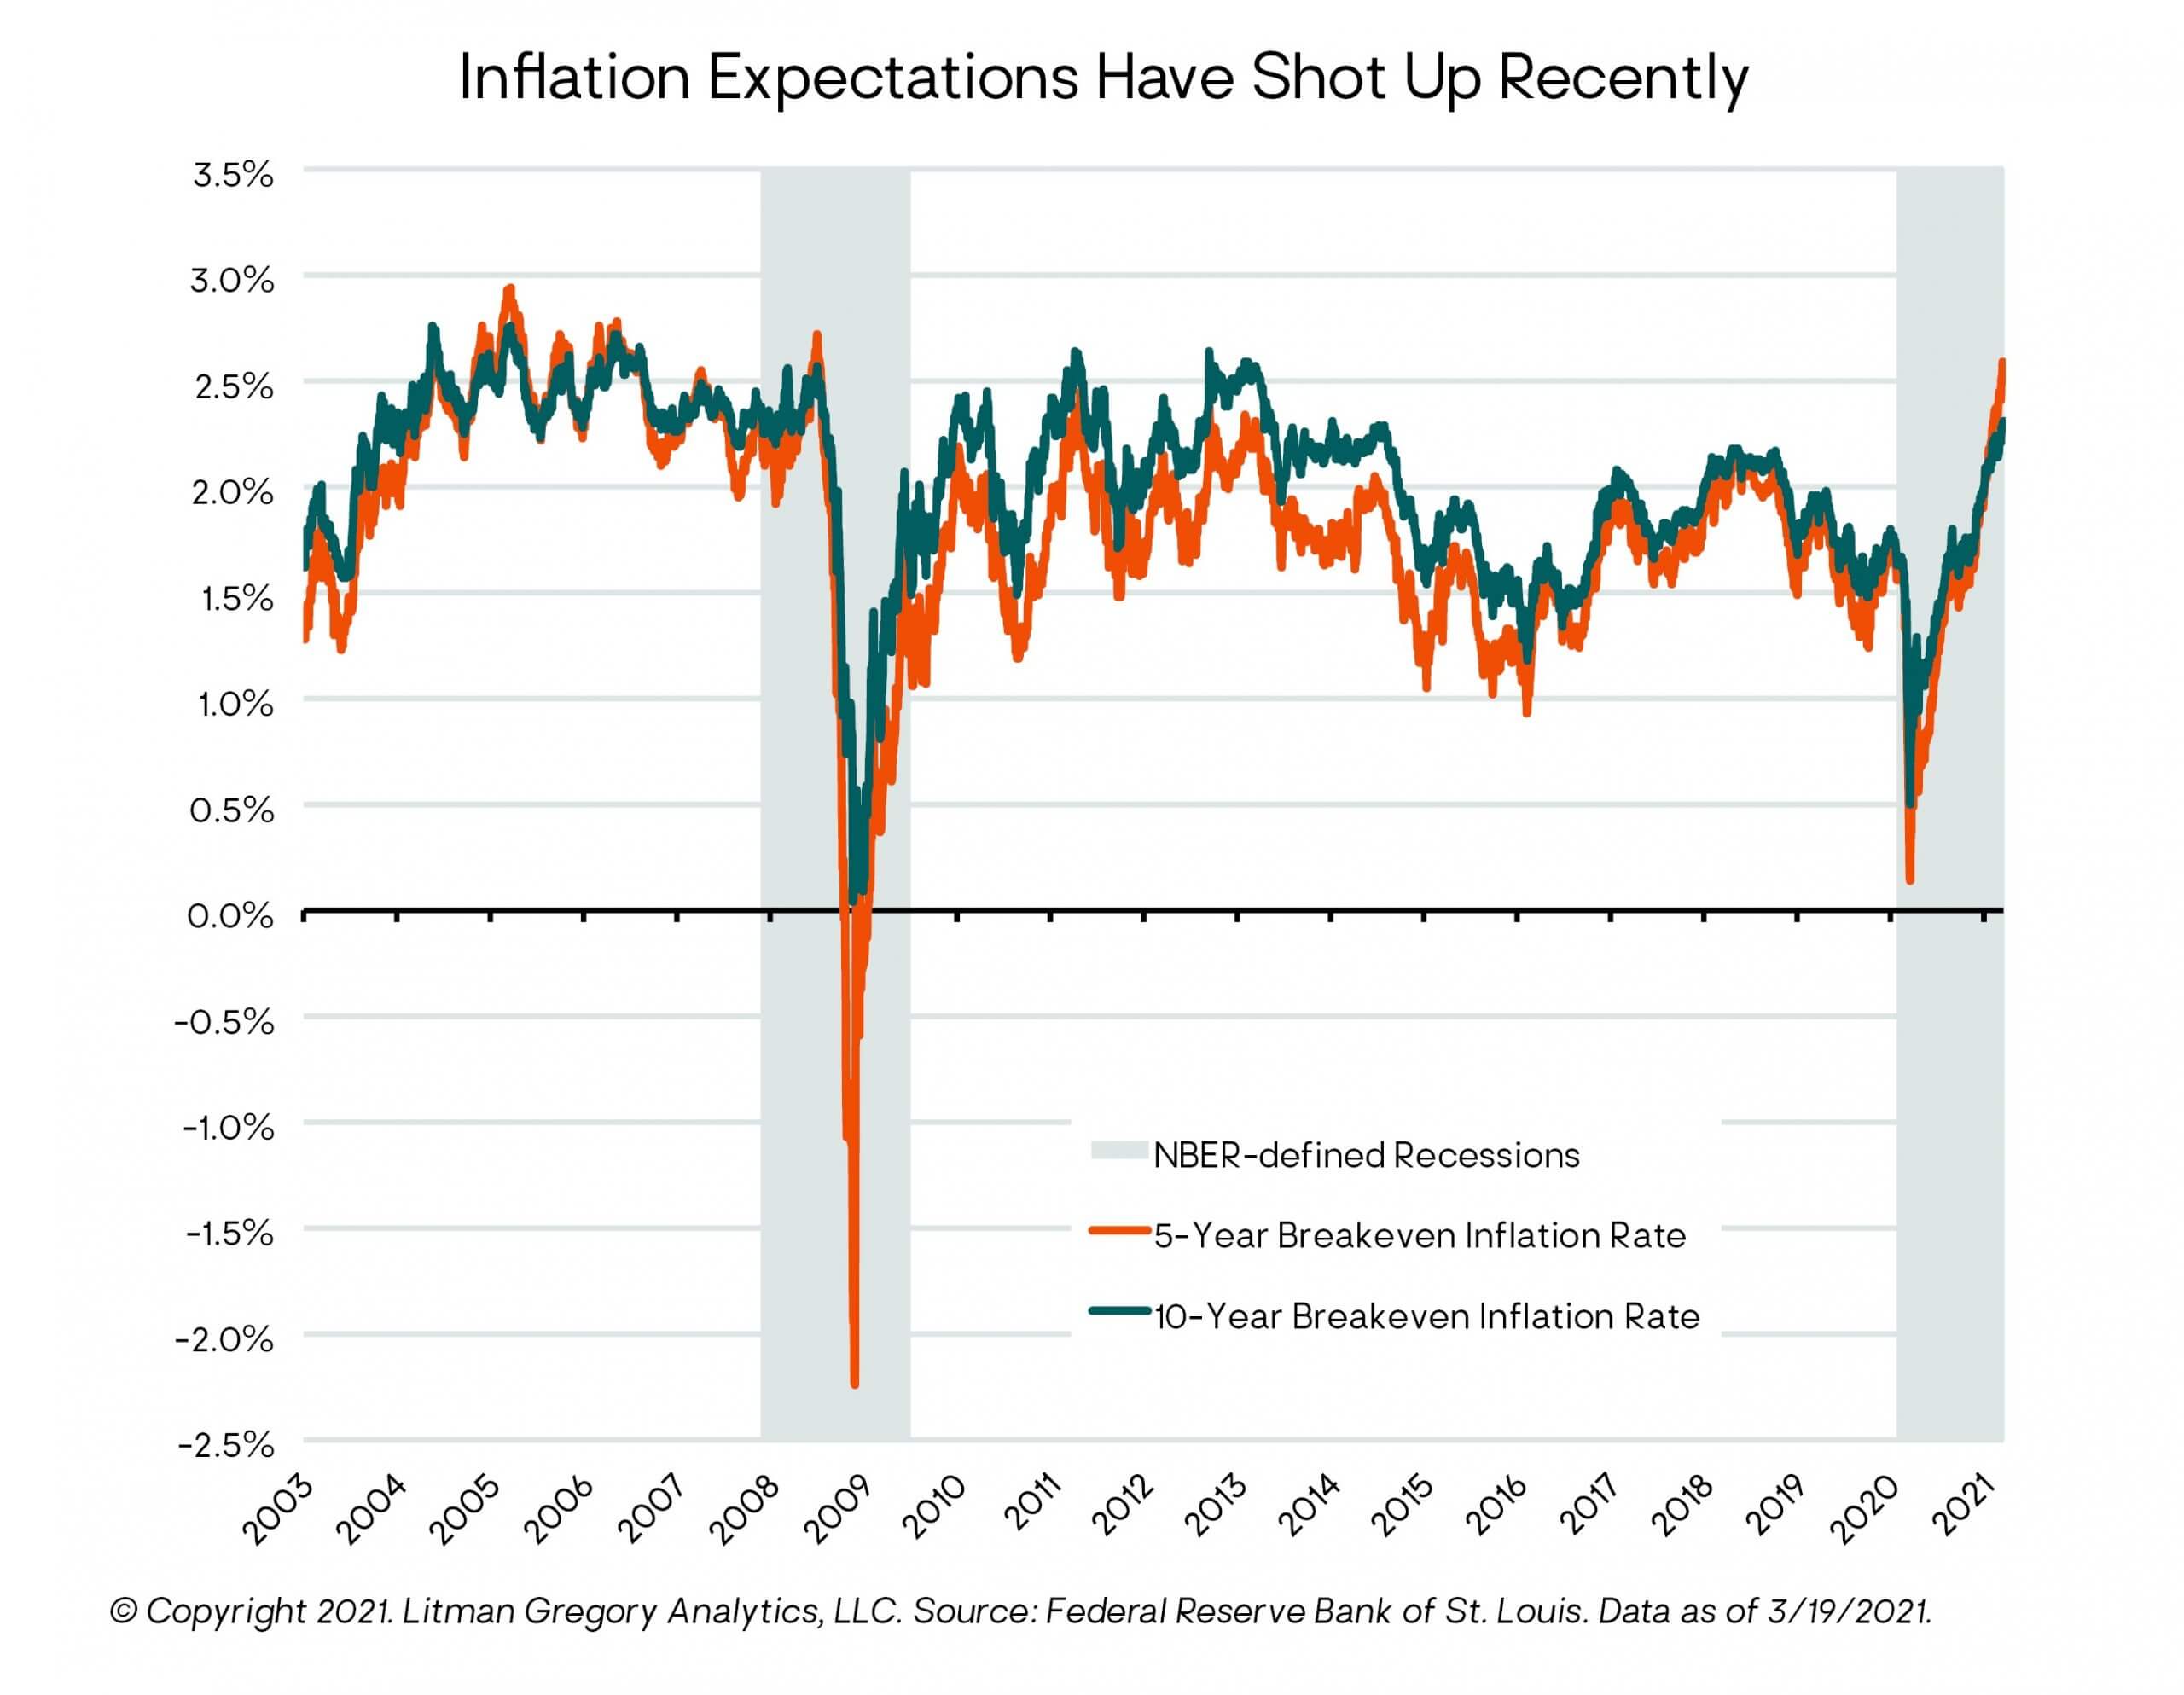
This is why the Fed is so focused on trying to anchor inflation expectations at around their 2% core target. But it doesn’t want them anchored too low either, as that increases the risk of a deflationary spiral. Digging out of a deflationary hole can be even harder and more damaging to an economy than halting an inflationary spiral. Getting the inflationary porridge just right is the Fed’s eternal challenge.
In the next few months, the headline inflation rate will spike higher (likely into the 3%-plus range). This will be due to a combination of the flow-through from recent commodity price inflation, temporary supply-chain bottlenecks, and most significantly, so-called base effects—meaning the year-over-year inflation calculation based off the temporarily depressed price levels during the early months of the pandemic. As the months roll on, the base effects from a year earlier will roll off.
But expert opinions diverge as to whether this is likely the beginning of a sharp and sustained rise in inflation, potentially on the order of what the economy experienced in the stagflationary 1970s, or just a temporary blip before it settles back to around 2% or lower. 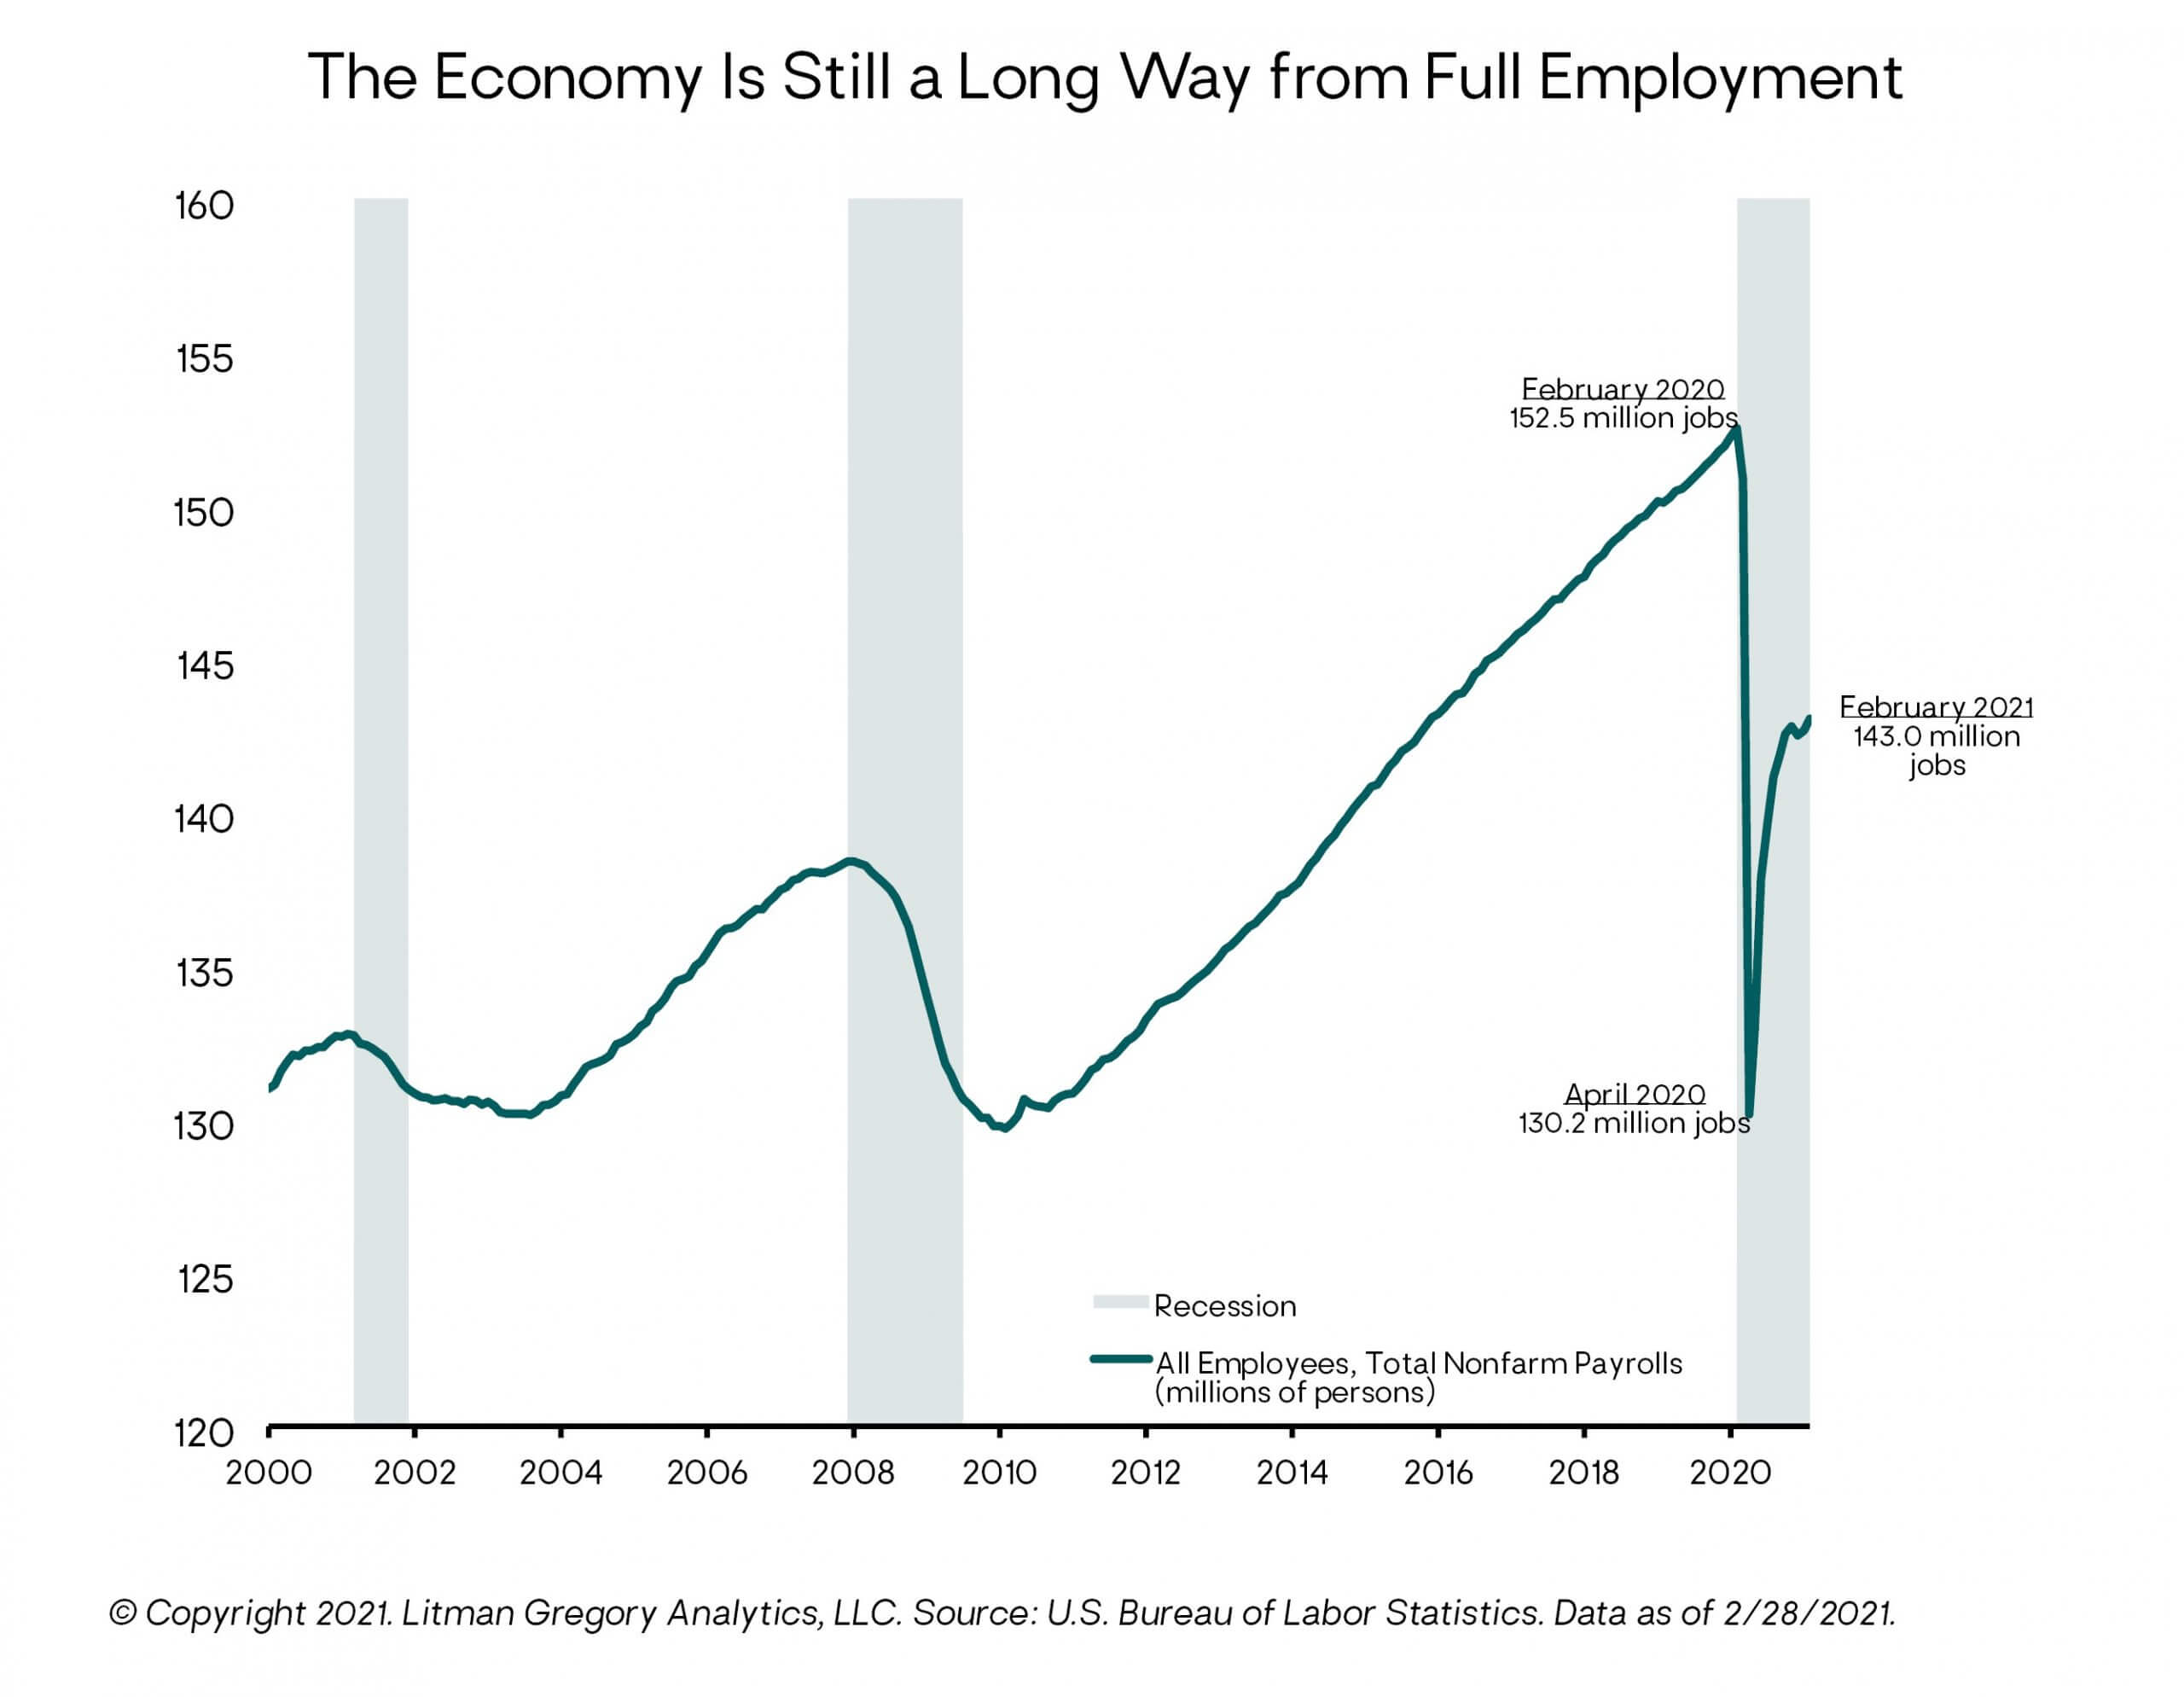
We continue to think the weight of the evidence leans toward a low likelihood of a major sustained rise in the inflation rate, at least for the next few years. The two key reasons behind our leaning are: (1) the economy still has tremendous slack—in terms of the gap between current and potential GDP and to reach maximum employment; and (2) the pandemic-related fiscal stimulus is temporary. Structural disinflationary forces also remain, such as demographic trends and technology, automation, and digitalization adoption, with the latter accelerating during the pandemic.
While GDP growth should sharply rebound this year, it is likely to take at least a few years to close the labor market gap. The economy is still roughly 8.4 million jobs below where it was in February 2020. Accounting for the natural growth in the labor force since then puts it even farther behind the full-employment curve.
Moreover, even at the February 2020 unemployment rate low of 3.5%, core PCE inflation was only 1.8%—still below the Fed’s 2% target. So the economy was probably not yet at maximum employment even then. This is an important part of the reason the Fed says it is no longer going to rely on unemployment-driven inflation forecasts and preemptively tightening monetary policy.
Finally, while the headline unemployment rate (known as U3) has come down to 6.0%, a broader measure of total unemployment or underemployment (known as U6)—which adds back to the labor pool (1) unemployed people who currently are not officially looking for work but say they want a job and have looked for work sometime in the past 12 months, plus (2) part-time workers who would like to work full time—stood at 10.7%. The Fed has also been highlighting a pandemic-adjusted unemployment rate that is currently around 10%.
As long as there is still slack in the labor market, a sharp rise in broad wage inflation is not a high risk. And wage inflation is necessary for an inflationary spiral to take hold: a wage-price spiral where workers demand higher wages in response to rising prices, and businesses then raise prices further in response to rising labor and input costs, leading to higher inflation and increasing wage demands, etc.
Remember, inflation is a rate of change in prices. To have a sustained inflationary period requires an ongoing increase or acceleration in that rate of change, not a one-time or short-term increase in the price level, nor an ongoing but steady rate of inflation each year.
Currently, we do not view a sustained and material increase in U.S. core inflation as a likely near-term outcome. Of course, nothing is certain when it comes to economics or investing, so we always manage our investment portfolios with a range of plausible potential economic outcomes and market scenarios in mind. Our views and leanings will change as the evidence changes.
And we do see increased risk of a more inflationary economic regime as we look farther out on our five-year tactical time horizon. This could play out due to a combination of political factors (for example, the rise of populism) and fiscal and monetary policies that are targeted to reduce inequality, maximize employment, and reduce the real (after-inflation) debt burden for both households and the federal government—all of which would likely be inflationary.
Our Financial Market Outlooks & Portfolio Positioning
Moving from the macro to the markets, how does our current economic view impact our financial market and asset class outlooks and portfolio positioning?
To cut to the chase: On balance, we have a positive shorter-term view on return-generating (higher-risk) assets (stocks and corporate bonds/loans), consistent with the supportive macro and policy backdrop.
First, we’ll highlight two broad market risks: (1) rising interest rates, and (2) U.S. equity valuation risk (our old friend).
Interest Rate Risk
As we noted in the First Quarter Market Recap above, Treasury yields have moved sharply higher this year. All else equal, higher interest rates are negative for equity valuations as they reduce the present value of future (discounted) corporate profits. And of course, rising bond yields correspond directly to falling bond prices, hence the negative year-to-date returns for core bonds and Treasuries.
But for equities, other factors also matter: the level from which rates are rising, the rapidity (or graduality) of the increase, whether the interest rate rise is due to improved economic growth expectations or due to rising inflation concerns (are we in a reflationary or an inflationary regime?), and what consensus expectations or assumptions are already being incorporated in current equity prices.
With nominal rates still at very low levels, real (inflation-adjusted) yields still negative, and a sustained rise in inflation over the near term not being our base case, we don’t view a sharp and sustained rise in interest rates from current levels as a likely outcome.
This is not to say that Treasury yields can’t increase further from here. But absent evidence of sustained inflationary pressure, and given the Fed’s commitment to keeping the fed funds rate at zero, we don’t expect yields to rise so much or for such a sustained period (yet) that they would trigger a bear market in stocks or other long-term-return-generating assets.
To the extent rates continue to rise due to a reflating and recovering economy, we would expect the recent trends in relative performance within the U.S. stock market to continue—with value, cyclical, and financial sectors outperforming growth, defensive, and tech sectors.
Valuation Risk
Absolute valuations for the U.S. stock market haven’t meaningfully changed over the past three months; they still look expensive relative to historical averages across a wide range of metrics.
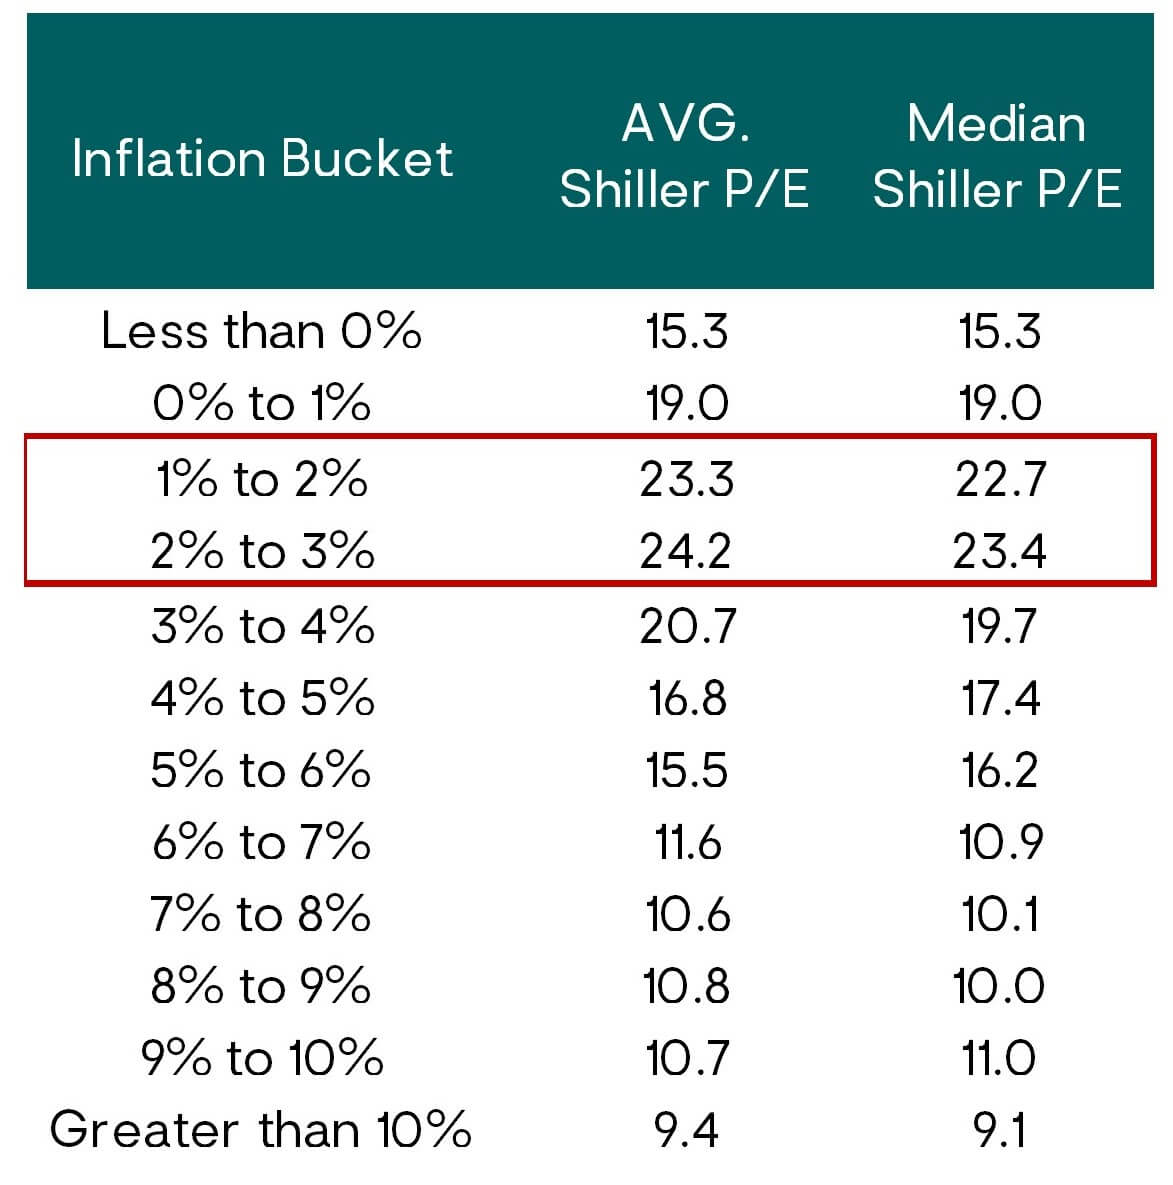
Source: Robert J. Shiller, U.S. Bureau of Economic Analysis. Highlighted rows indicate inflation / valuation sweet spot.
However, the relative valuation of U.S. stocks versus bonds—taking into account current bond yields—is still reasonably attractive, although less so as bond yields have risen during this period.
Low bond yields are typically associated with low inflation environments. So, one might expect absolute equity valuations to generally be higher when inflation is low (but not so low as to reflect a deflationary scenario, which would be very bad for stocks). The table below shows this has historically been the case, with the sweet spot for the S&P 500 Index valuation multiple, represented by the Shiller price-to-earnings (P/E) ratio in this example, occurring on average when the inflation rate has been between 1% and 3%.
Not surprisingly, the underlying monthly data points reveal a wide range of historical outcomes around the average P/E for each inflation bucket. It makes sense that low inflation doesn’t automatically equate to higher valuations; there are so many other variables that also impact valuation. But the data does indicate that if the market is going to have a higher-than-average multiple, it at least needs lower inflation: low inflation (and low interest rates) are necessary but not sufficient.
Therefore, one’s views on valuation risk are to some degree tied to one’s views on interest rate and inflation risk. And those, in turn, tie to some degree to one’s views on the prospects and timing for controlling COVID-19; an economic recovery; closing the labor market gap; rising wage pressures; fiscal, monetary, and regulatory policy actions; and geopolitical events—to name a few—and the inter-relationships and feedback loops between human/herd psychology and behavior and these variables, against a constantly evolving global structural backdrop.
Our investment decision-making and portfolio management account for this inherent complexity and uncertainty by incorporating a wide range of potential outcomes and scenarios. We also adapt and update our analysis and conclusions as facts and events evolve.
We think it is unwise to bet too heavily on any single outcome or forecast. But our analysis does lead us to view some outcomes (or range of outcomes) as more likely than others.
Our current base-case scenario can be summarized as follows:
- With a very low likelihood of recession as the economy emerges from the pandemic, and supported by accommodative fiscal and monetary policy, the fundamentals (earnings growth, profit margins, cash flows, debt coverage) underpinning higher-returning asset classes (stocks, corporate bonds, floating-rate loans, structured credit/asset-backed securities, etc.) should be well supported.
- As long as interest rates do not move sharply higher, absolute valuations for these asset classes can remain elevated or expand further in the shorter term.
- Meanwhile, relative equity valuations have room to rise. Or put differently, the equity risk premium has room to contract.
Portfolio Positioning
Over the past several months we have been reassessing the key assumptions underlying our U.S. equity market analysis. The result of this analysis is that our base-case five-year expected return range for U.S. stocks has improved. Our work suggests that the S&P 500 at 3,950 is currently priced at the top end (the expensive end) of our updated fair value range. (We will be publishing a separate more detailed write-up on this soon.)
As such, we are not as negative on U.S. stocks on an absolute-return basis as we had been. However, the U.S. market remains less attractive on an expected-return basis compared to EM stocks, so we retain our tactical underweight to U.S. stocks and overweight to EM stocks.
Of course, a benign macro backdrop and improved five-year expected returns don’t mean stocks can’t suffer declines of 10% or more as the markets digest day-to-day news flow and investor herd momentum feeds on itself. Equity owners always need to be prepared for market volatility and to remain disciplined through the twists and turns. The current environment is no exception. For example, the larger-cap U.S. growth stock index (Russell 1000 Growth Index) recently dropped 10% over a 14-day period in February and March, and EM stocks were down 9%.
In terms of our overall risk exposure in our balanced portfolios, we are positioned slightly on the conservative side of neutral, due to our modest underweight to equities. However, within our risk asset exposure we have a bias toward reflationary assets: We favor EM stocks over U.S. stocks, and floating-rate loans and flexible active bond strategies over core bonds. This is balanced against positions in portfolio diversifiers and risk reducers that will hold up better than stocks in an economic shock: alternative strategies and core bonds.
A Bit More on the Role of Core Bonds
We believe core bonds still serve an important role in more conservative/risk-averse portfolios as ballast and diversification against equity risk and volatility. While our base case for core bonds’ five-year expected return is still very low, it has improved as yields have risen over the past year. However, we don’t own core bonds for their long-term return potential. We own them for their shorter-term risk-mitigating properties in a recessionary or deflationary environment.
Now, as noted above in our inflation discussion, we do see an increased chance of an inflationary regime taking hold toward the latter part of our five-year tactical time horizon. History and economic logic suggest that in a sustained inflationary or stagflationary environment, core bonds won’t provide the same risk-reduction benefits relative to stocks. This is because interest rates will be rising—hurting bond returns—and equity market valuations and prices are also likely to come under pressure. Both stock and core bond returns may be negative.
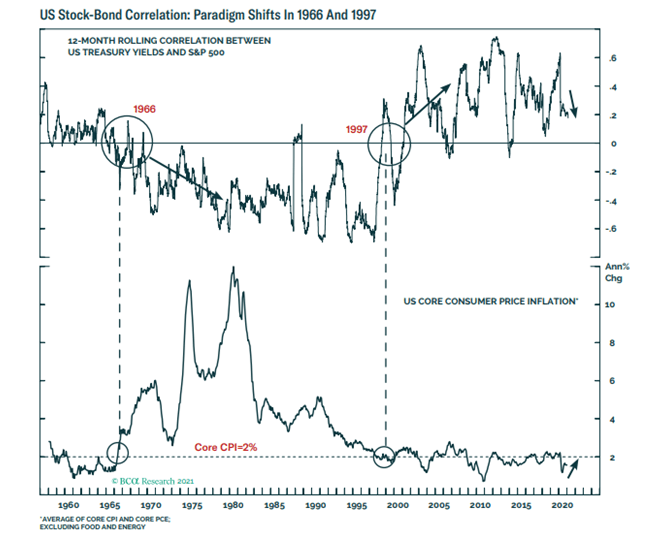
Source: BCA Research
Put differently, the correlation between stock market returns and bond market yields may switch from positive to negative if we shift from the current low-inflation regime (with well-anchored inflation expectations) to an inflationary or stagflationary regime.
As the chart to the right from BCA Research shows, the U.S. markets experienced this type of regime change in the mid-1960s when investors shifted to an inflationary mindset. In this regime, rising bond yields reflected rising inflationary fears, which is bad for both bonds and stocks. Then, in the late 1990s, the regime switched back as core inflation and inflation expectations settled down around 2%. In this post-90s regime, deflationary fears dominated the market psychology, so rising yields came to reflect a reflationary (but not inflationary) growth outlook, which is a positive environment for corporate fundamentals, equity valuations, and equity market returns.
Closing Thoughts
We don’t see a high likelihood of an imminent market paradigm shift. But we are alert to it and see the odds increasing as time goes on. As such, our fixed-income exposure and overall equity-risk management are more diversified than simply owning core bonds.
As we’ve described in prior commentaries, what has worked so well for the past 10, 20, 30, 40 years—a simple 60%/40% U.S. stocks/core bonds balanced model—won’t work nearly as well over the next five to 10 years (at least), even without an upsurge in inflation. We are already accounting for this in our portfolio positioning. As the macroeconomic regime evolves, we will tactically, but prudently, adapt and adjust our portfolio exposures based on our assessment of the risks and potential returns.
In the meantime, we believe the most likely scenario over the next year at least is a reflationary one, enabling solid to strong returns (mid to upper single or low double digits) from global equities—favoring non-U.S. markets and more cyclically sensitive or value sectors—and decent to solid returns from credit-oriented fixed-income strategies that should handily outperform core bonds given their yield advantage and active management flexibility. We also expect our diversifying and lower-risk alternative strategies funds to outperform core bonds.
On the private funds side (for accredited or qualified purchasers), we continue to see opportunities for strong absolute and relative return potential in selective, well-managed private equity, private credit, and real estate funds.
We believe our portfolios are well positioned for further gains this year as the U.S. and global economy continue to recover. We expect many of the asset markets and market sectors that have been laggards over the past five to 10 years to continue to rebound as part of the broad reflation rotation described above. For our clients who include active managers in their portfolio implementation, we believe this environment also offers excellent opportunities for active management across both equities and fixed income to add value relative to core market indexes.
—Litman Gregory Investment Team (4/6/21)