Commentary from Our CIO—Second Quarter 2022
It’s been an extremely difficult year for investors, with equity markets falling into bear market territory (down more than 20%) and “low-risk” bond markets registering low double-digit losses. Over the past few months the economic backdrop has worsened with sustained high inflation and slowing growth, as the Federal Reserve and other global central banks aggressively tighten monetary policy. Exogenous shocks — the Russian war on Ukraine and China’s zero-COVID lockdowns – continue to further disrupt the global economy and financial markets.
It’s natural to be concerned about these developments and worry about what the future holds. It feels better when our investment portfolios are going up than when they’re going down. But when it comes to investing, doing what feels good in the moment isn’t usually the best long-term decision.
In this investment commentary, we will dig into the recent market and economic developments, what’s changed since the first quarter, and how it has impacted our near-term (six to 12 month) and medium-term (five-year) outlooks.
In a nutshell: In the near-term, we think it is prudent to expect more equity market pain ahead as an economic slowdown and potential recession will likely lead to corporate earnings disappointments triggering further stock price declines. But with global stock markets already down 20%-plus due to valuation compression and sharply higher bond yields, we believe much of the damage has already been done. Over a medium-term horizon, we view this as largely a healthy “re-set” for the markets: a normal cyclical downturn setting the stage for more attractive forward-looking returns.
As always, investment discipline and patience – staying the course and remaining invested through these choppy waters — is necessary to be in position to realize the better returns to come. Given the wide range of potential outcomes, risks and unknowns, portfolio diversification beyond traditional U.S. stocks and core bonds also remains important, in our view.
Second Quarter Market Recap
After a rough first quarter, global stocks and bonds suffered further sharp markdowns in the second quarter as stagflation fears and rising interest rates pummeled both broad asset classes.
Global stocks (MSCI ACWI Index) fell 15.7% for the quarter and are down 20.2% for the year. The S&P 500 dropped 16.1% for the quarter and is also down 20% for the year, after being down as much as 24% through mid-June. Developed international markets (MSCI EAFE Index) were down 14.5% for the quarter and 19.6% YTD. Emerging Market (EM) stocks held up a bit better, dropping 11.4% for the quarter, and down 17.6% YTD.
Foreign equity market returns for U.S. dollar-based investors were hurt (again) by the sharp appreciation of the dollar; the dollar index was up 6.5% for the quarter and 9.5% on the year. Conversely, a weakening dollar versus other currencies would benefit foreign asset returns, as we continue to expect over the medium-term.
Core investment-grade bonds were pummeled again in the second quarter, with the benchmark Bloomberg U.S. Aggregate Bond Index (the “Agg”) dropping 4.7%. This puts the “safe-haven” Agg down an incredible 10.3% for the year to date — its worst first-half ever. In other segments of the fixed-income markets, the U.S. high-yield bond index fell 9.9% and floating rate loans dropped 4.5% for the quarter.
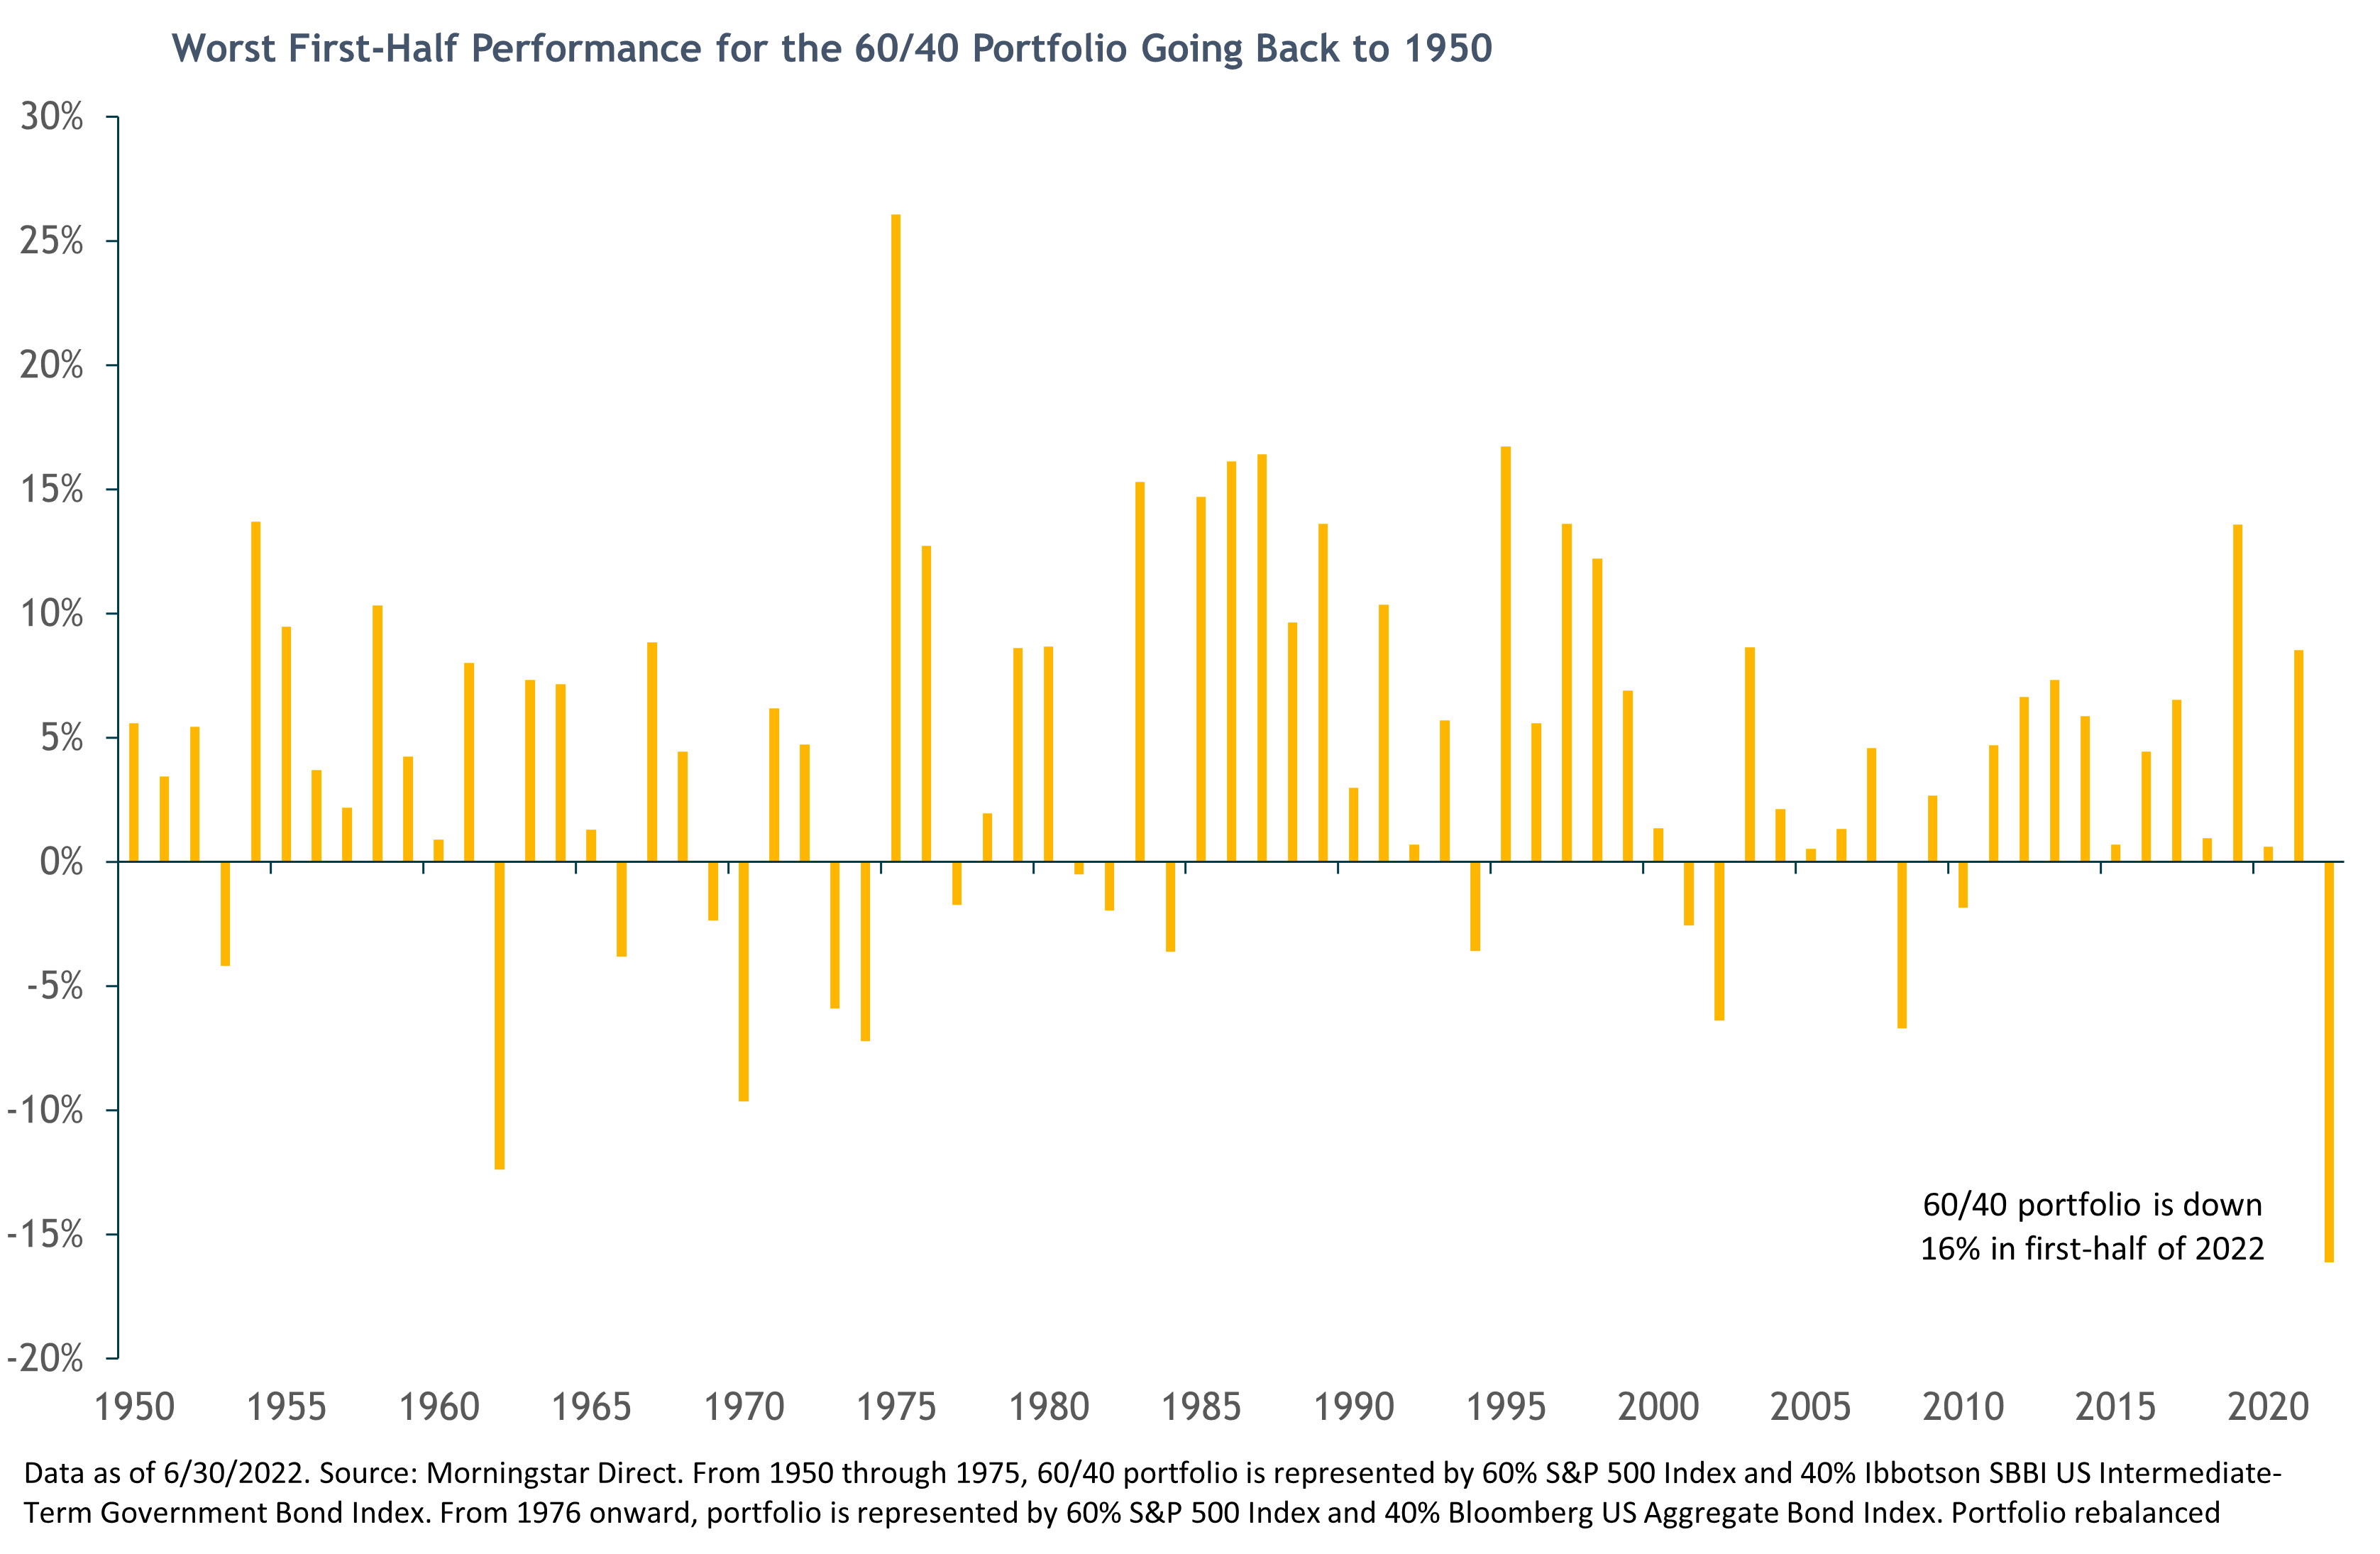
As we have long been pointing out, core bonds are not low-risk or defensive assets in an inflationary (rising interest rate) environment. Taken together with the equity bear market, this is by far the worst first-half performance for a traditional “60/40” balanced portfolio (60% S&P 500/40% Aggregate Bond Index) in modern history, down 16.1%. The previous worst first half was 1962, down 12%.
Portfolio diversification into “non-traditional” asset classes, non-core fixed-income market niches, and alternative strategies can be particularly valuable in an inflationary environment. We saw this in the first quarter and it continued in the second quarter. Trend-following managed futures strategies again led the way posting double-digit positive returns; the benchmark SG Trend Index gained 9.6%, benefiting from its short positions in bond and stock markets, i.e., it benefited as these markets declined. It’s also worth noting the Trend Index and active managed futures funds generally have now outperformed both global stocks (MSCI ACWI) and bonds (the Agg) by wide margins over the past three and five years.
Macro Backdrop: Recession Risk Continues to Rise as High Inflation Persists
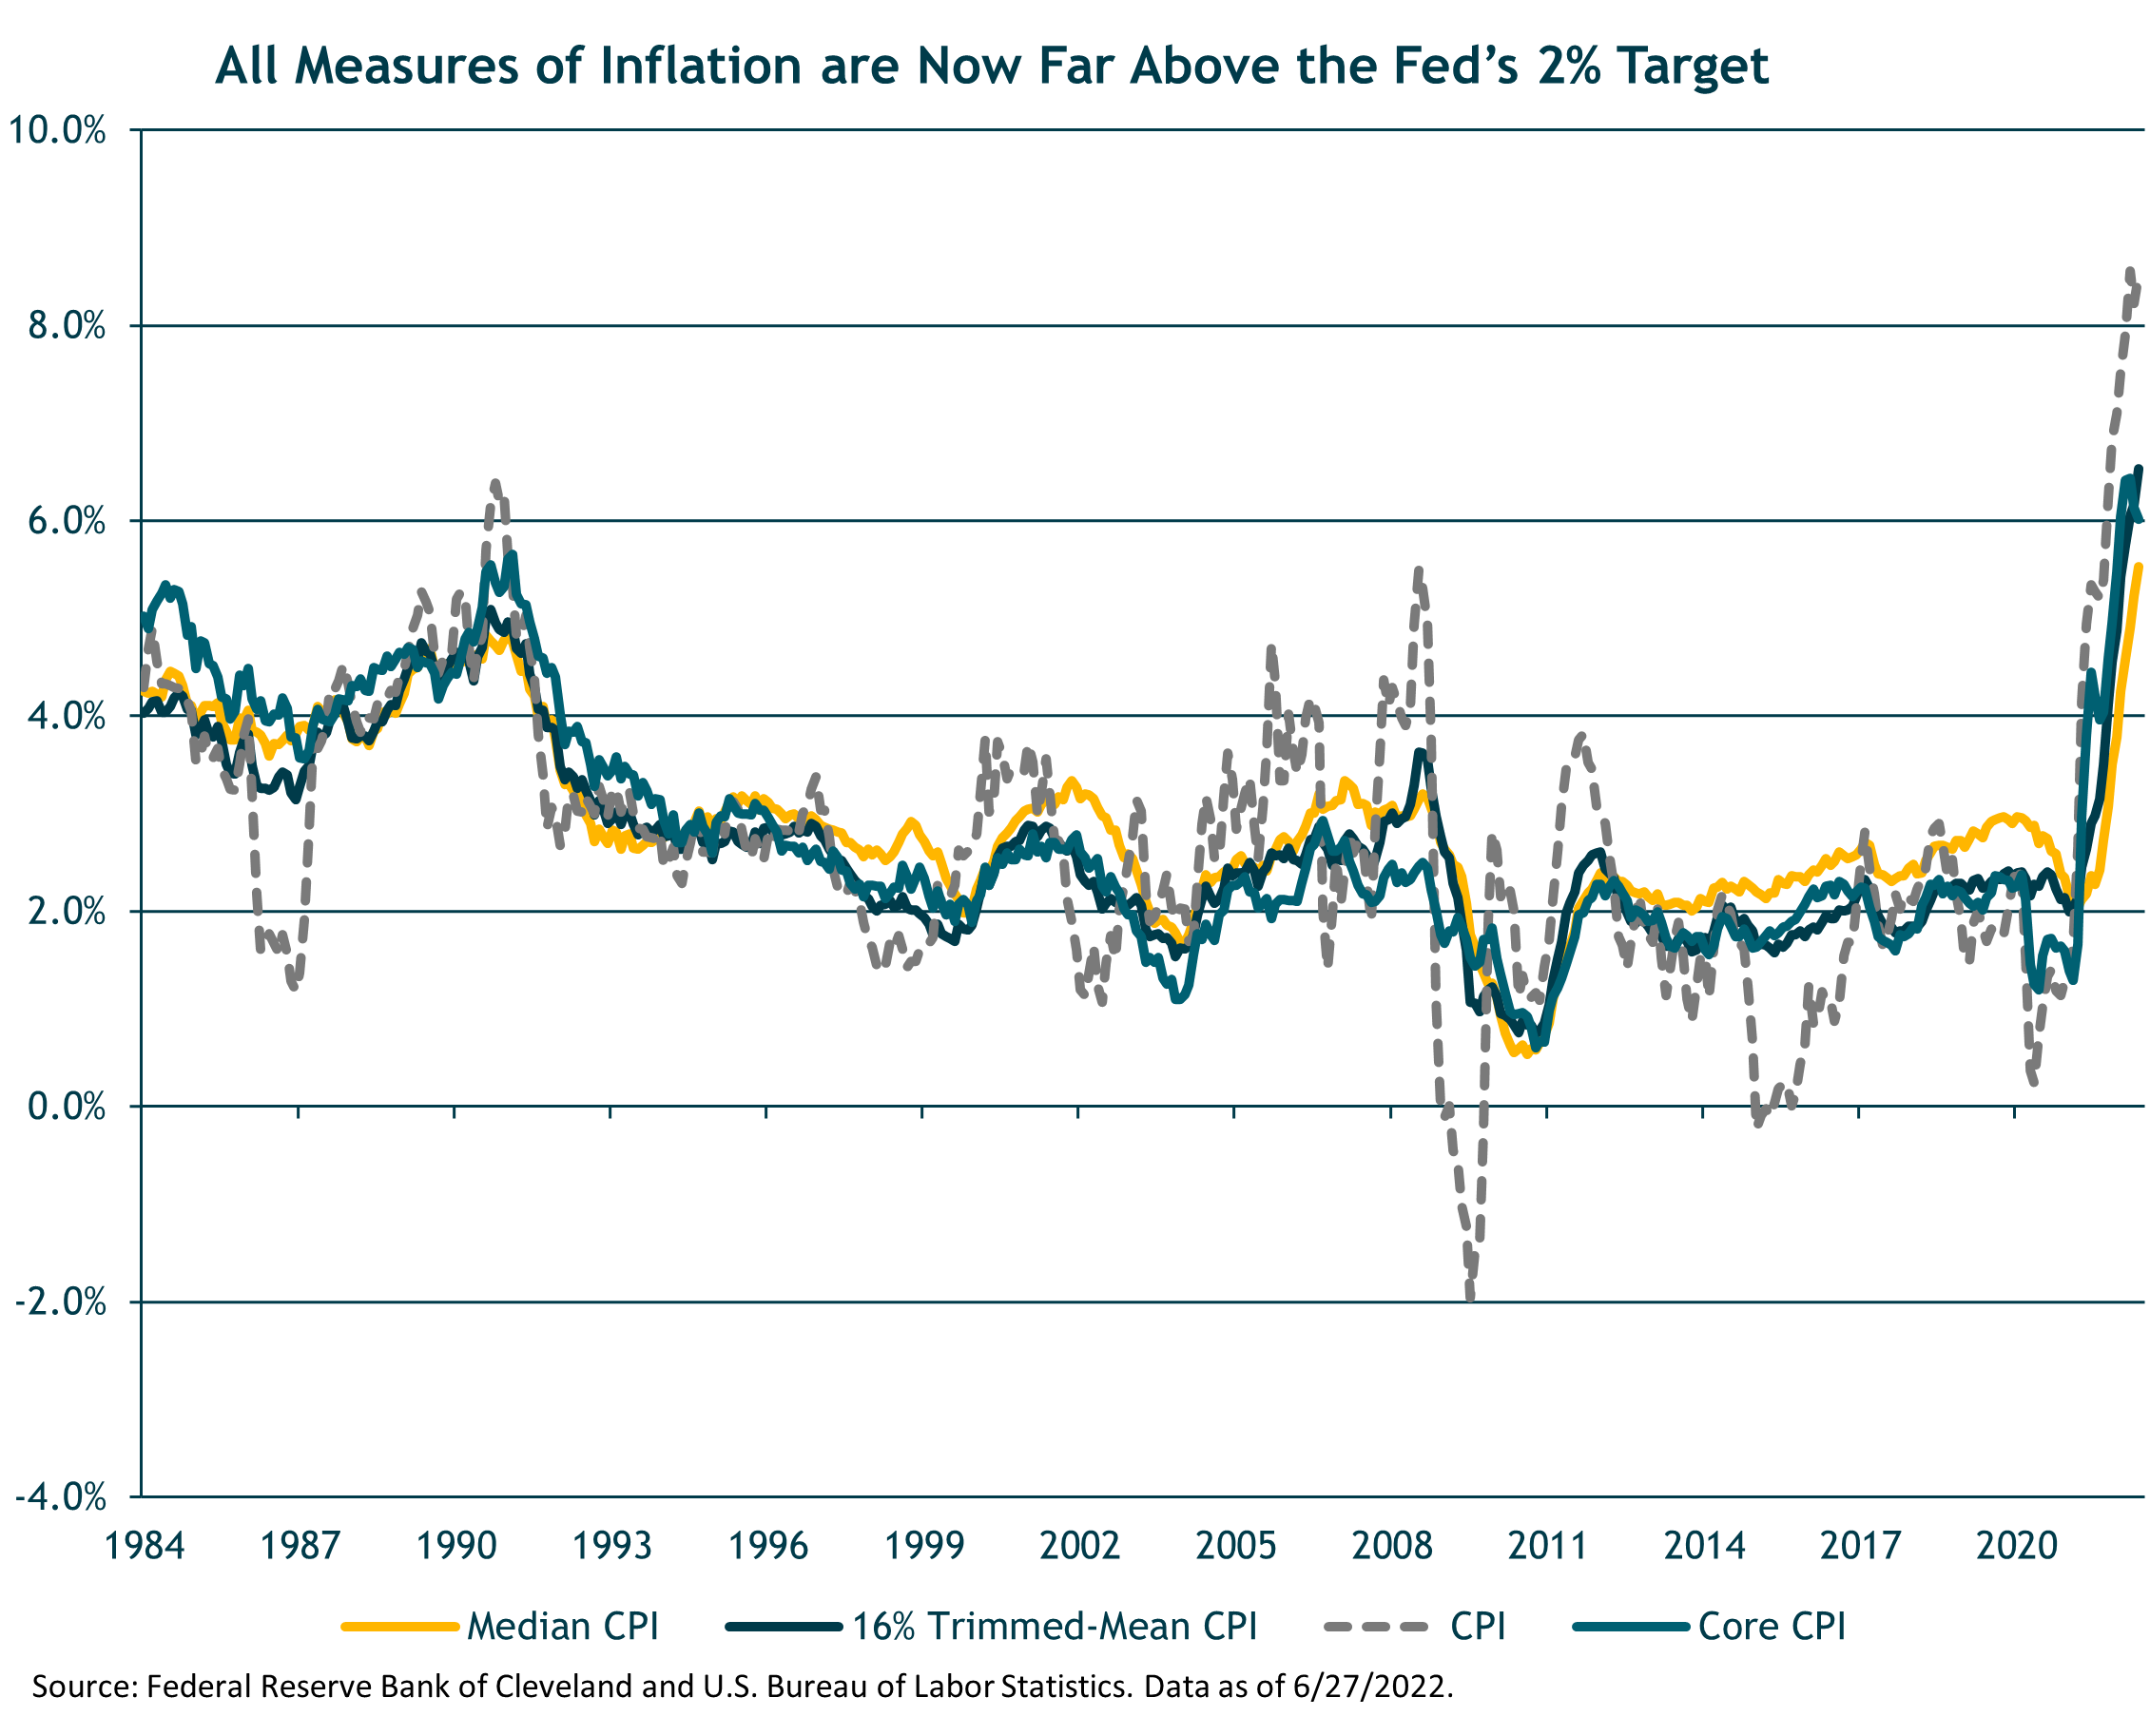
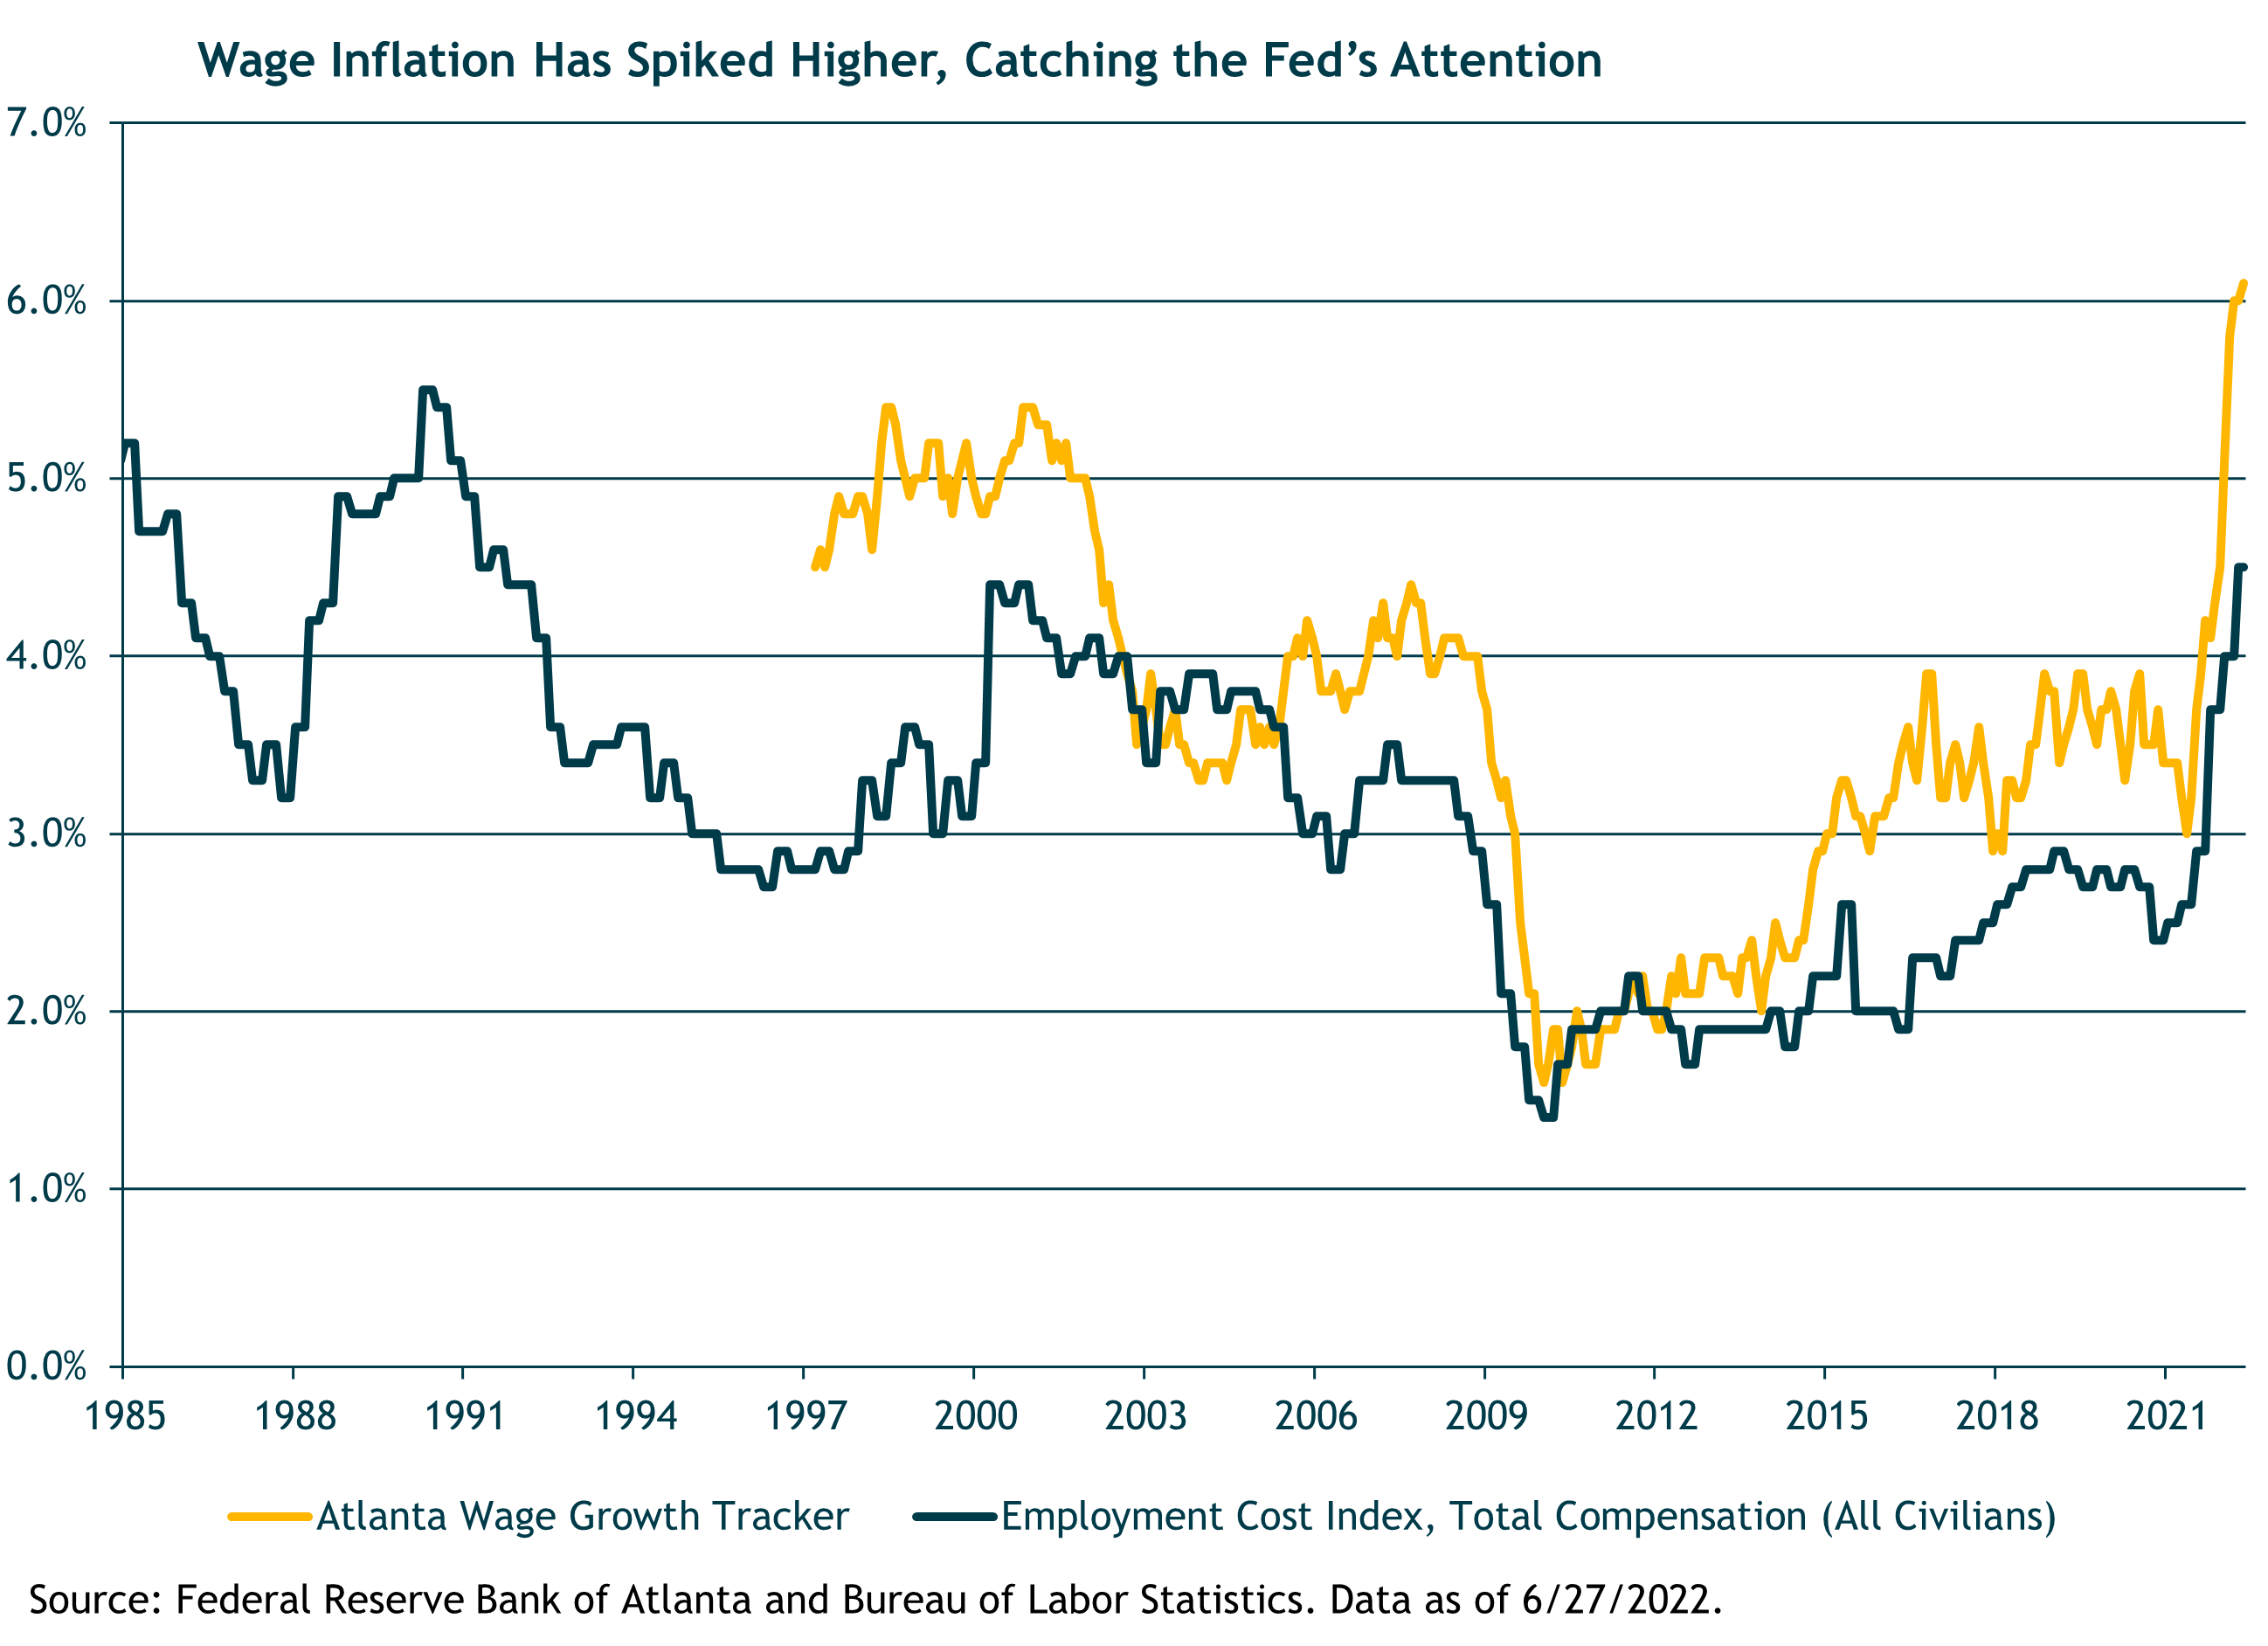
In our first quarter commentary we wrote that we “remain cautiously optimistic, but inflation and recession risks have risen.” Unfortunately, economic conditions have worsened since then. The key is inflation, which, counter to our earlier expectation, has not yet peaked. The May year-over-year headline CPI inflation rate (published in June) rose to 8.6%, from 8.3% in April. The median (5.5%) and trimmed-mean (6.5%) inflation rates also rose in May, although core CPI (6.0%) dipped.
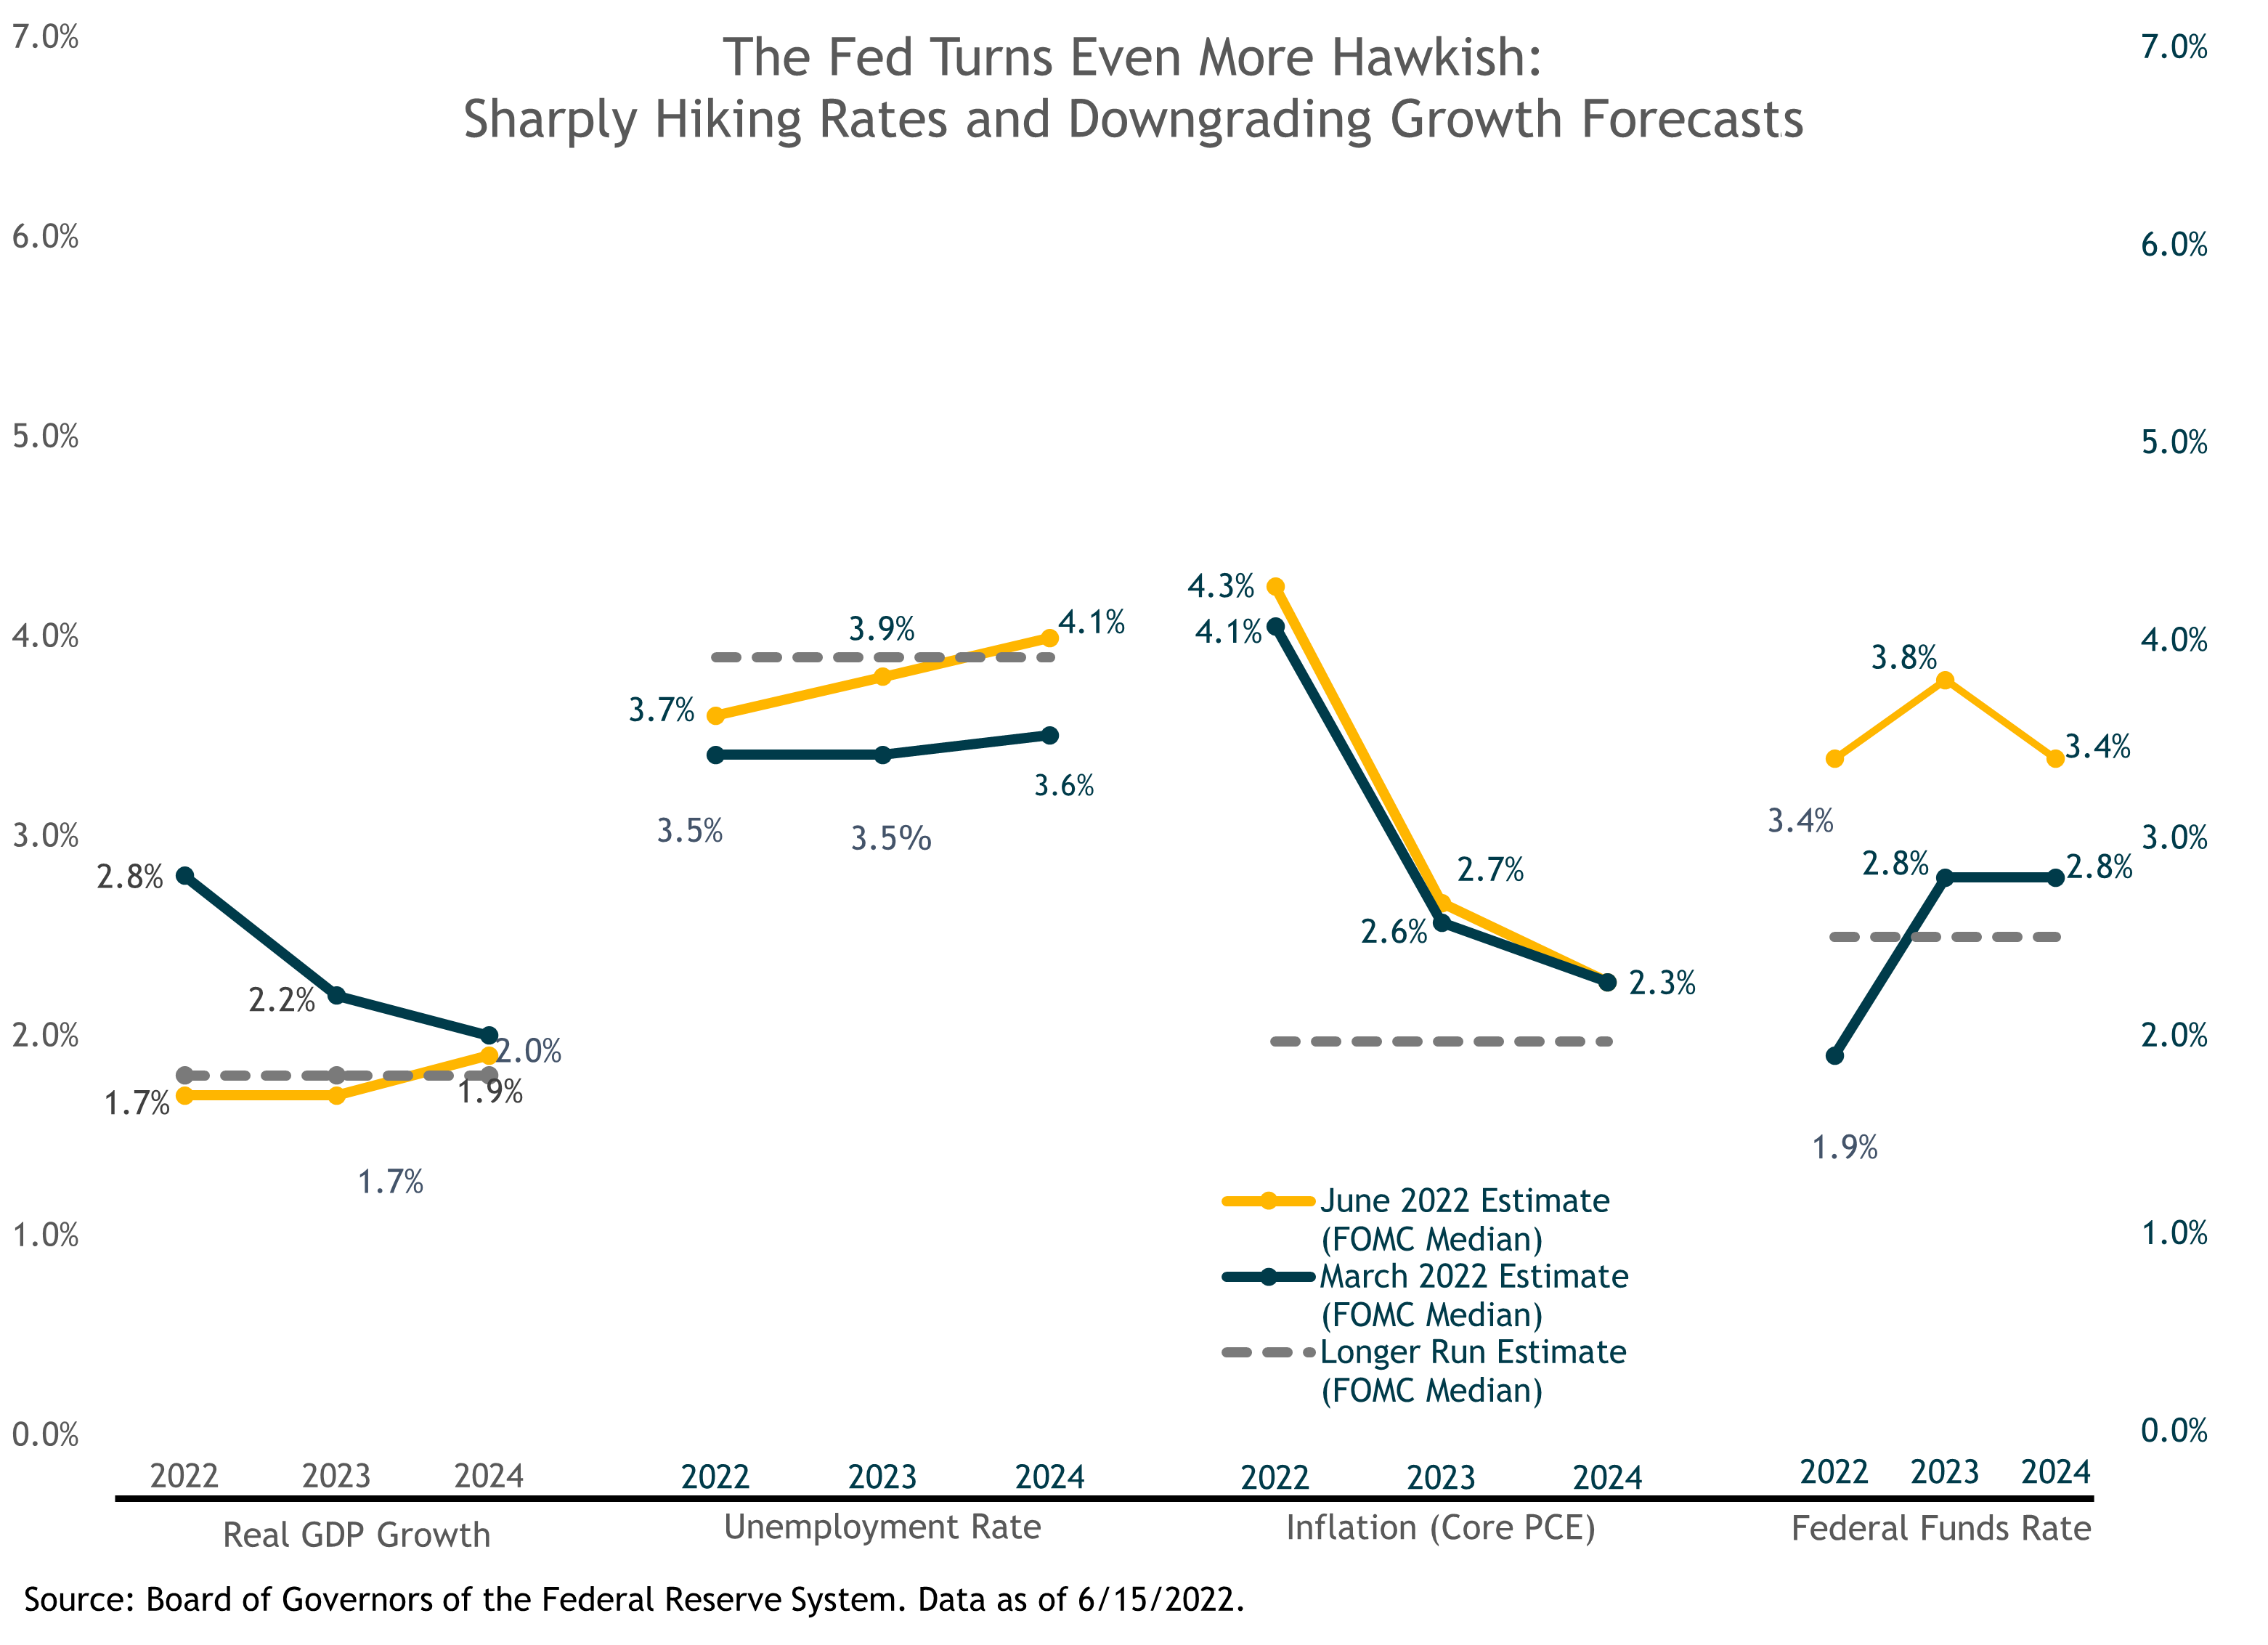
In response to the disappointing May inflation data, the Fed turned even more hawkish. At its June 15 FOMC meeting, the Fed hiked the policy interest rate (the federal funds rate) a larger-than-expected 75 basis points (0.75%), to a range of 1.50%-1.75%. The Fed committee members also sharply raised their median forecast for the year-end fed funds to 3.4% (from a 1.9% forecast at their March meeting). This implies another 175bps of rate hikes over their next four meetings and would put the rate into a restrictive zone for the economy, i.e., well above the Fed’s 2.5% estimate of the “neutral” long-run equilibrium fed funds rate. The committee members also sharply downgraded their median forecasts for U.S. real GDP growth to a below-trend 1.7% for both 2022 and 2023, reflecting their hope for a soft landing but not recession.
A sharp economic growth slowdown in the U.S. (and abroad) is all but certain this year. The risk of a U.S. recession within the next 12 months continues to rise, to the point where we’d call it a reasonable conservative base case. Having said that, it is the severity of any potential downturn and its impact on corporate earnings across a range of reasonably probable scenarios that is relevant for our investment approach, not forecasting a recession or no recession. What we are certain of is that the business cycle has not been revoked; recessions are inevitable — as are recoveries.
Of course, the Fed would never actually say they expect to cause a recession from tightening monetary policy – to do so would just about guarantee that outcome. But Fed Chair Powell went about as far as he could, testifying to Congress on June 22-23 that, “It’s not our intended outcome at all, but it’s certainly a possibility.”
We’d say it’s actually more than just a possibility because, according to Powell, the Fed’s’ commitment to bringing down inflation “is unconditional.” In other words, labor market conditions are no longer driving the Fed’s “price stability and full employment” dual mandate. It is now all about inflation, inflation, inflation.
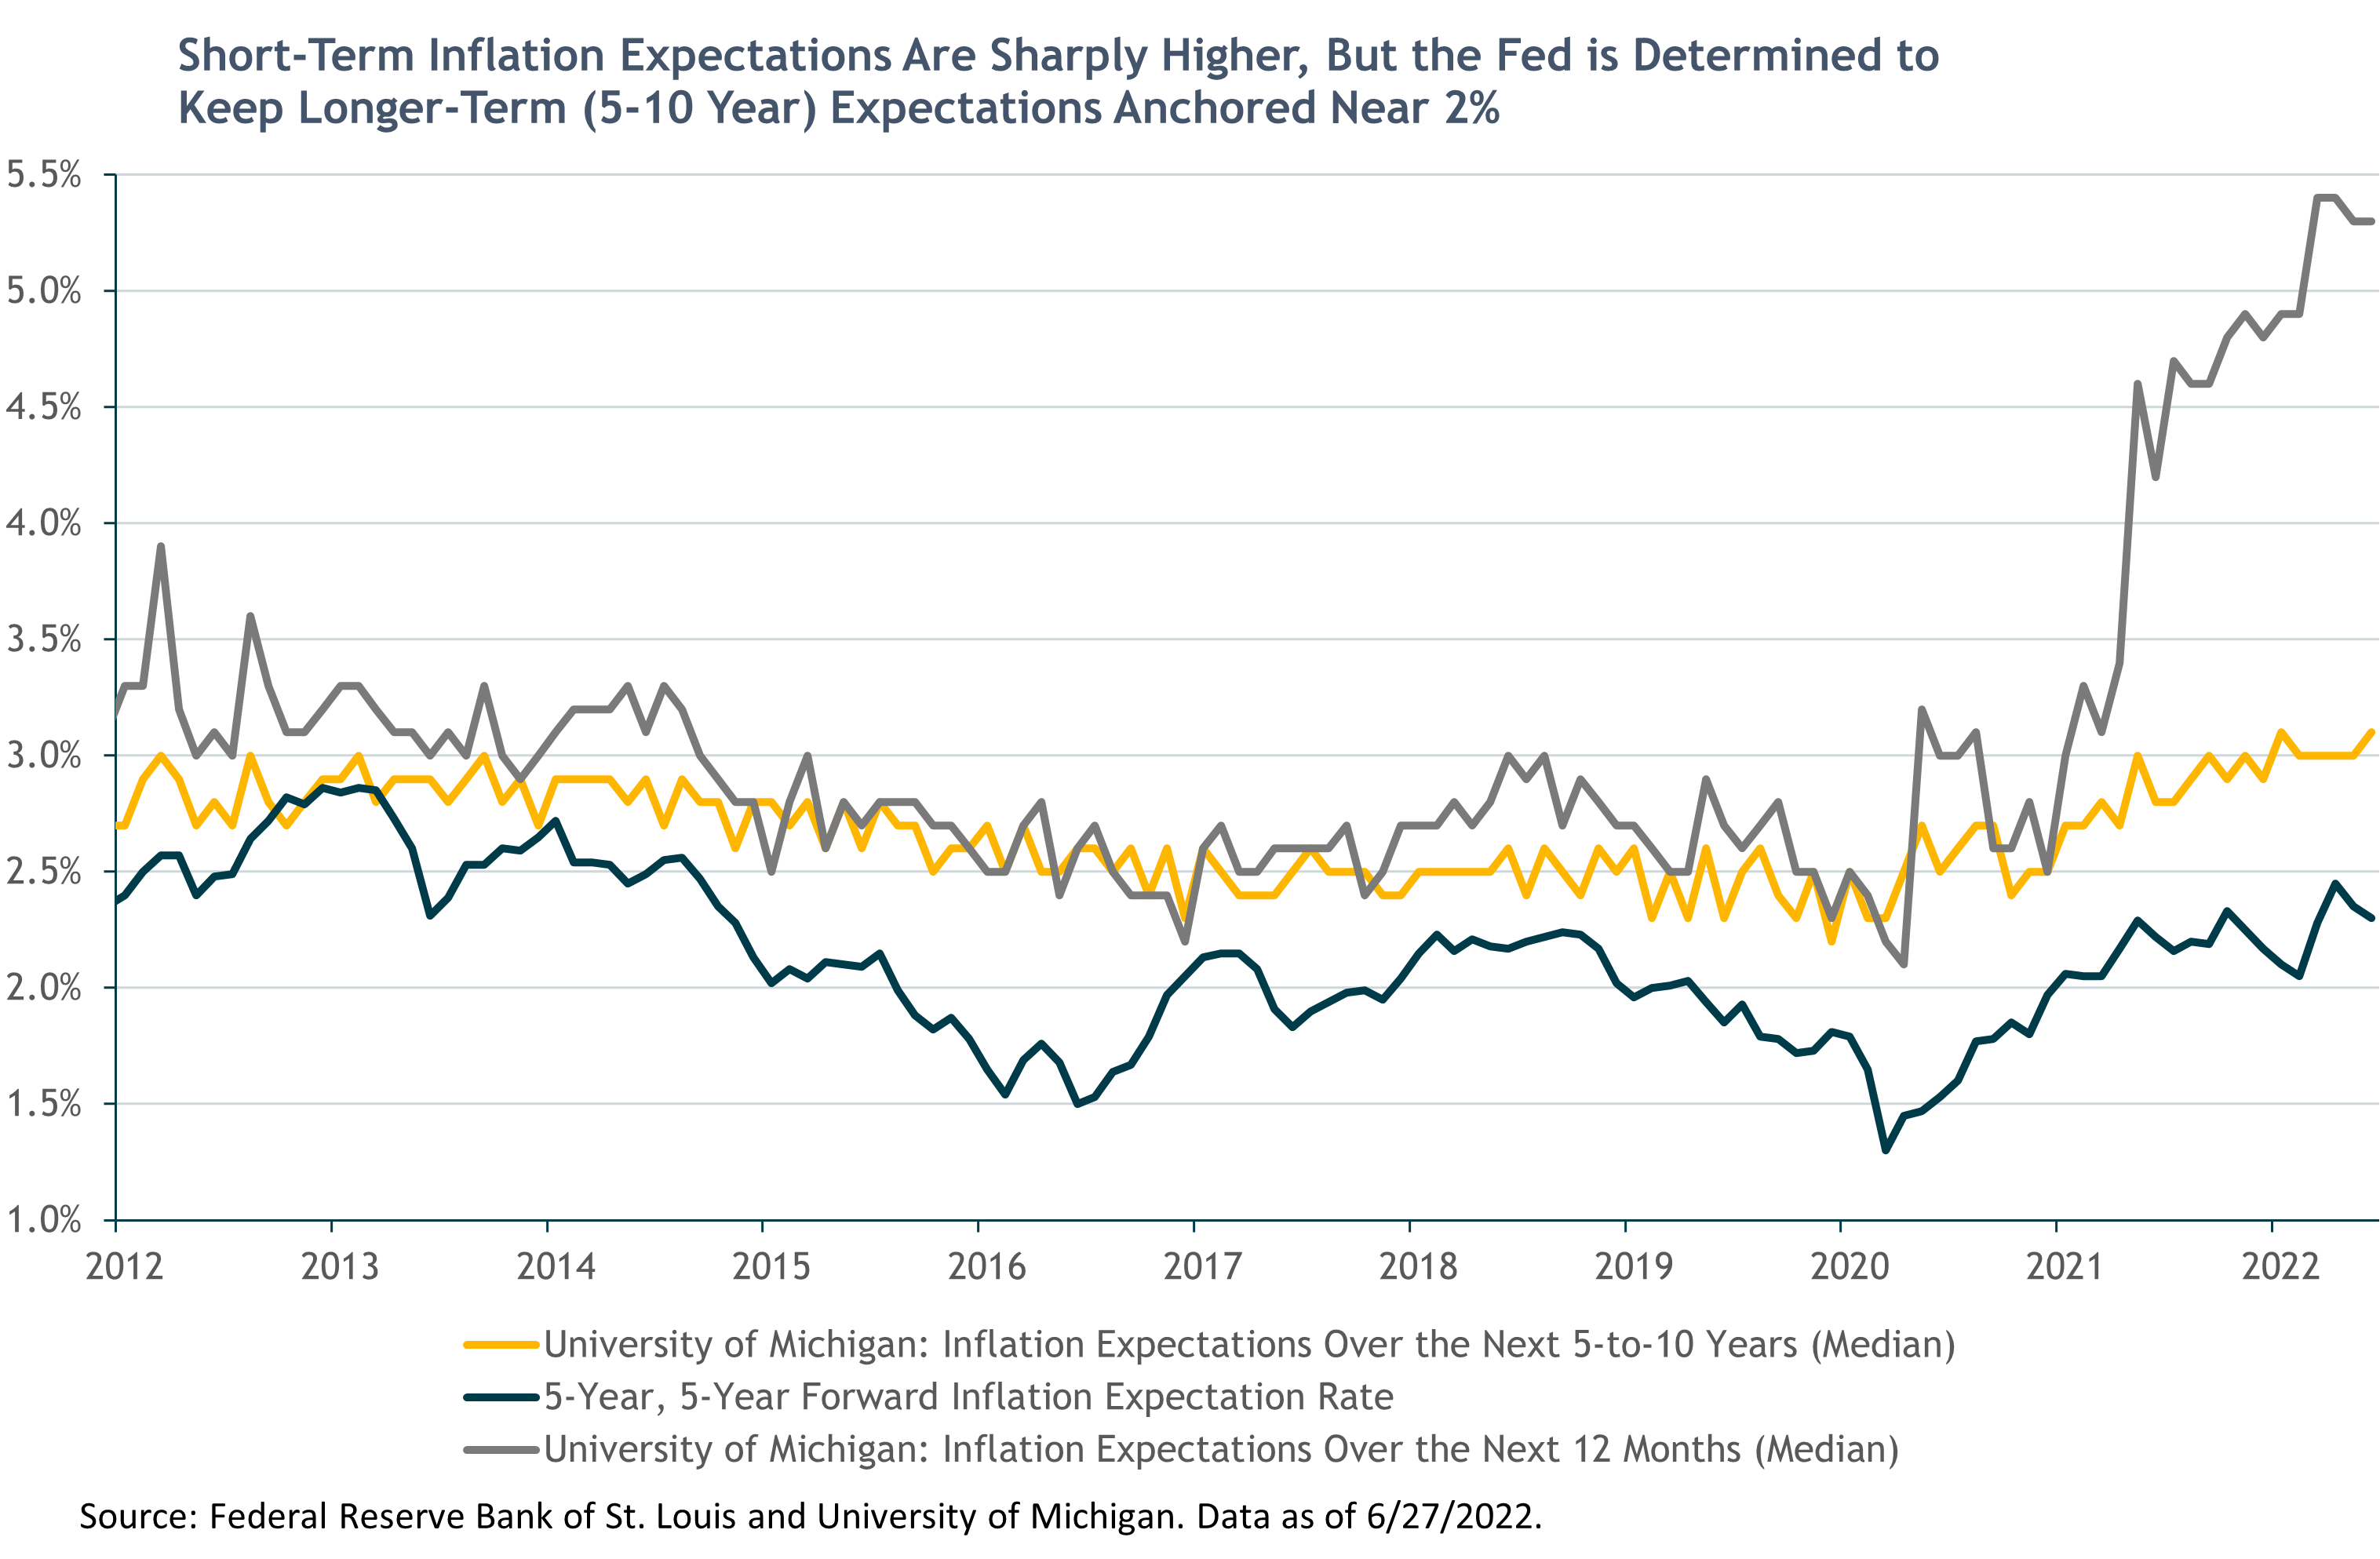
Powell went on to say the Fed wants to see “a series of declining monthly readings for inflation” as “clear and convincing evidence that inflation is coming down” before “we can consider moving at a slower pace.” He also again emphasized the Fed’s focus on longer-term (5-to-10 year) inflation expectations, saying the recent rise in the University of Michigan’s expectations survey was a factor in the decision to hike 75bp. (Ironically, this preliminary figure was revised lower a few days later.) “We’re absolutely determined to keep them anchored at 2%,” Powell said.
Tightening monetary policy leads to tighter “financial conditions”: higher interest rates, higher corporate bond yields (wider “credit spreads”), lower stock prices and a rising dollar. Tighter financial conditions in turn depress consumer and business spending, reducing aggregate demand in the economy. Lower demand (lower GDP growth) should reduce overall price pressures and hence inflation. That’s the Fed’s playbook and toolkit.
This simple economic cause-and-effect assumes the supply side of the economy remains steady. However, this has not been the case due to (1) the Russia/Ukraine war’s impact on energy and agricultural commodities, and (2) COVID-related supply chain disruptions. We expect (hope) these exogenous supply shocks will recede with time. But the Fed can’t do anything about them. As Powell said to Congress, “A soft landing … is going to be very challenging. It has been made significantly more challenging by the events of the last few months — thinking there of the war and of commodities prices and further problems with supply chains.”
BCA’s US investment strategist, Doug Peta put it well: “Soft landings are extremely elusive. It is fiendishly difficult to fine-tune a complex multi-faceted economy with central bankers’ blunt tools.”
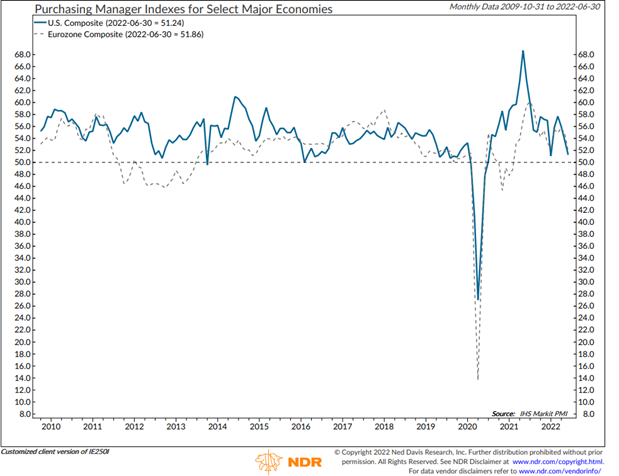
Purchasing Manager Indexes for U.S. and Europe Have Turned Sharply Lower in Recent Months … but are still in expansion territory (above 50)
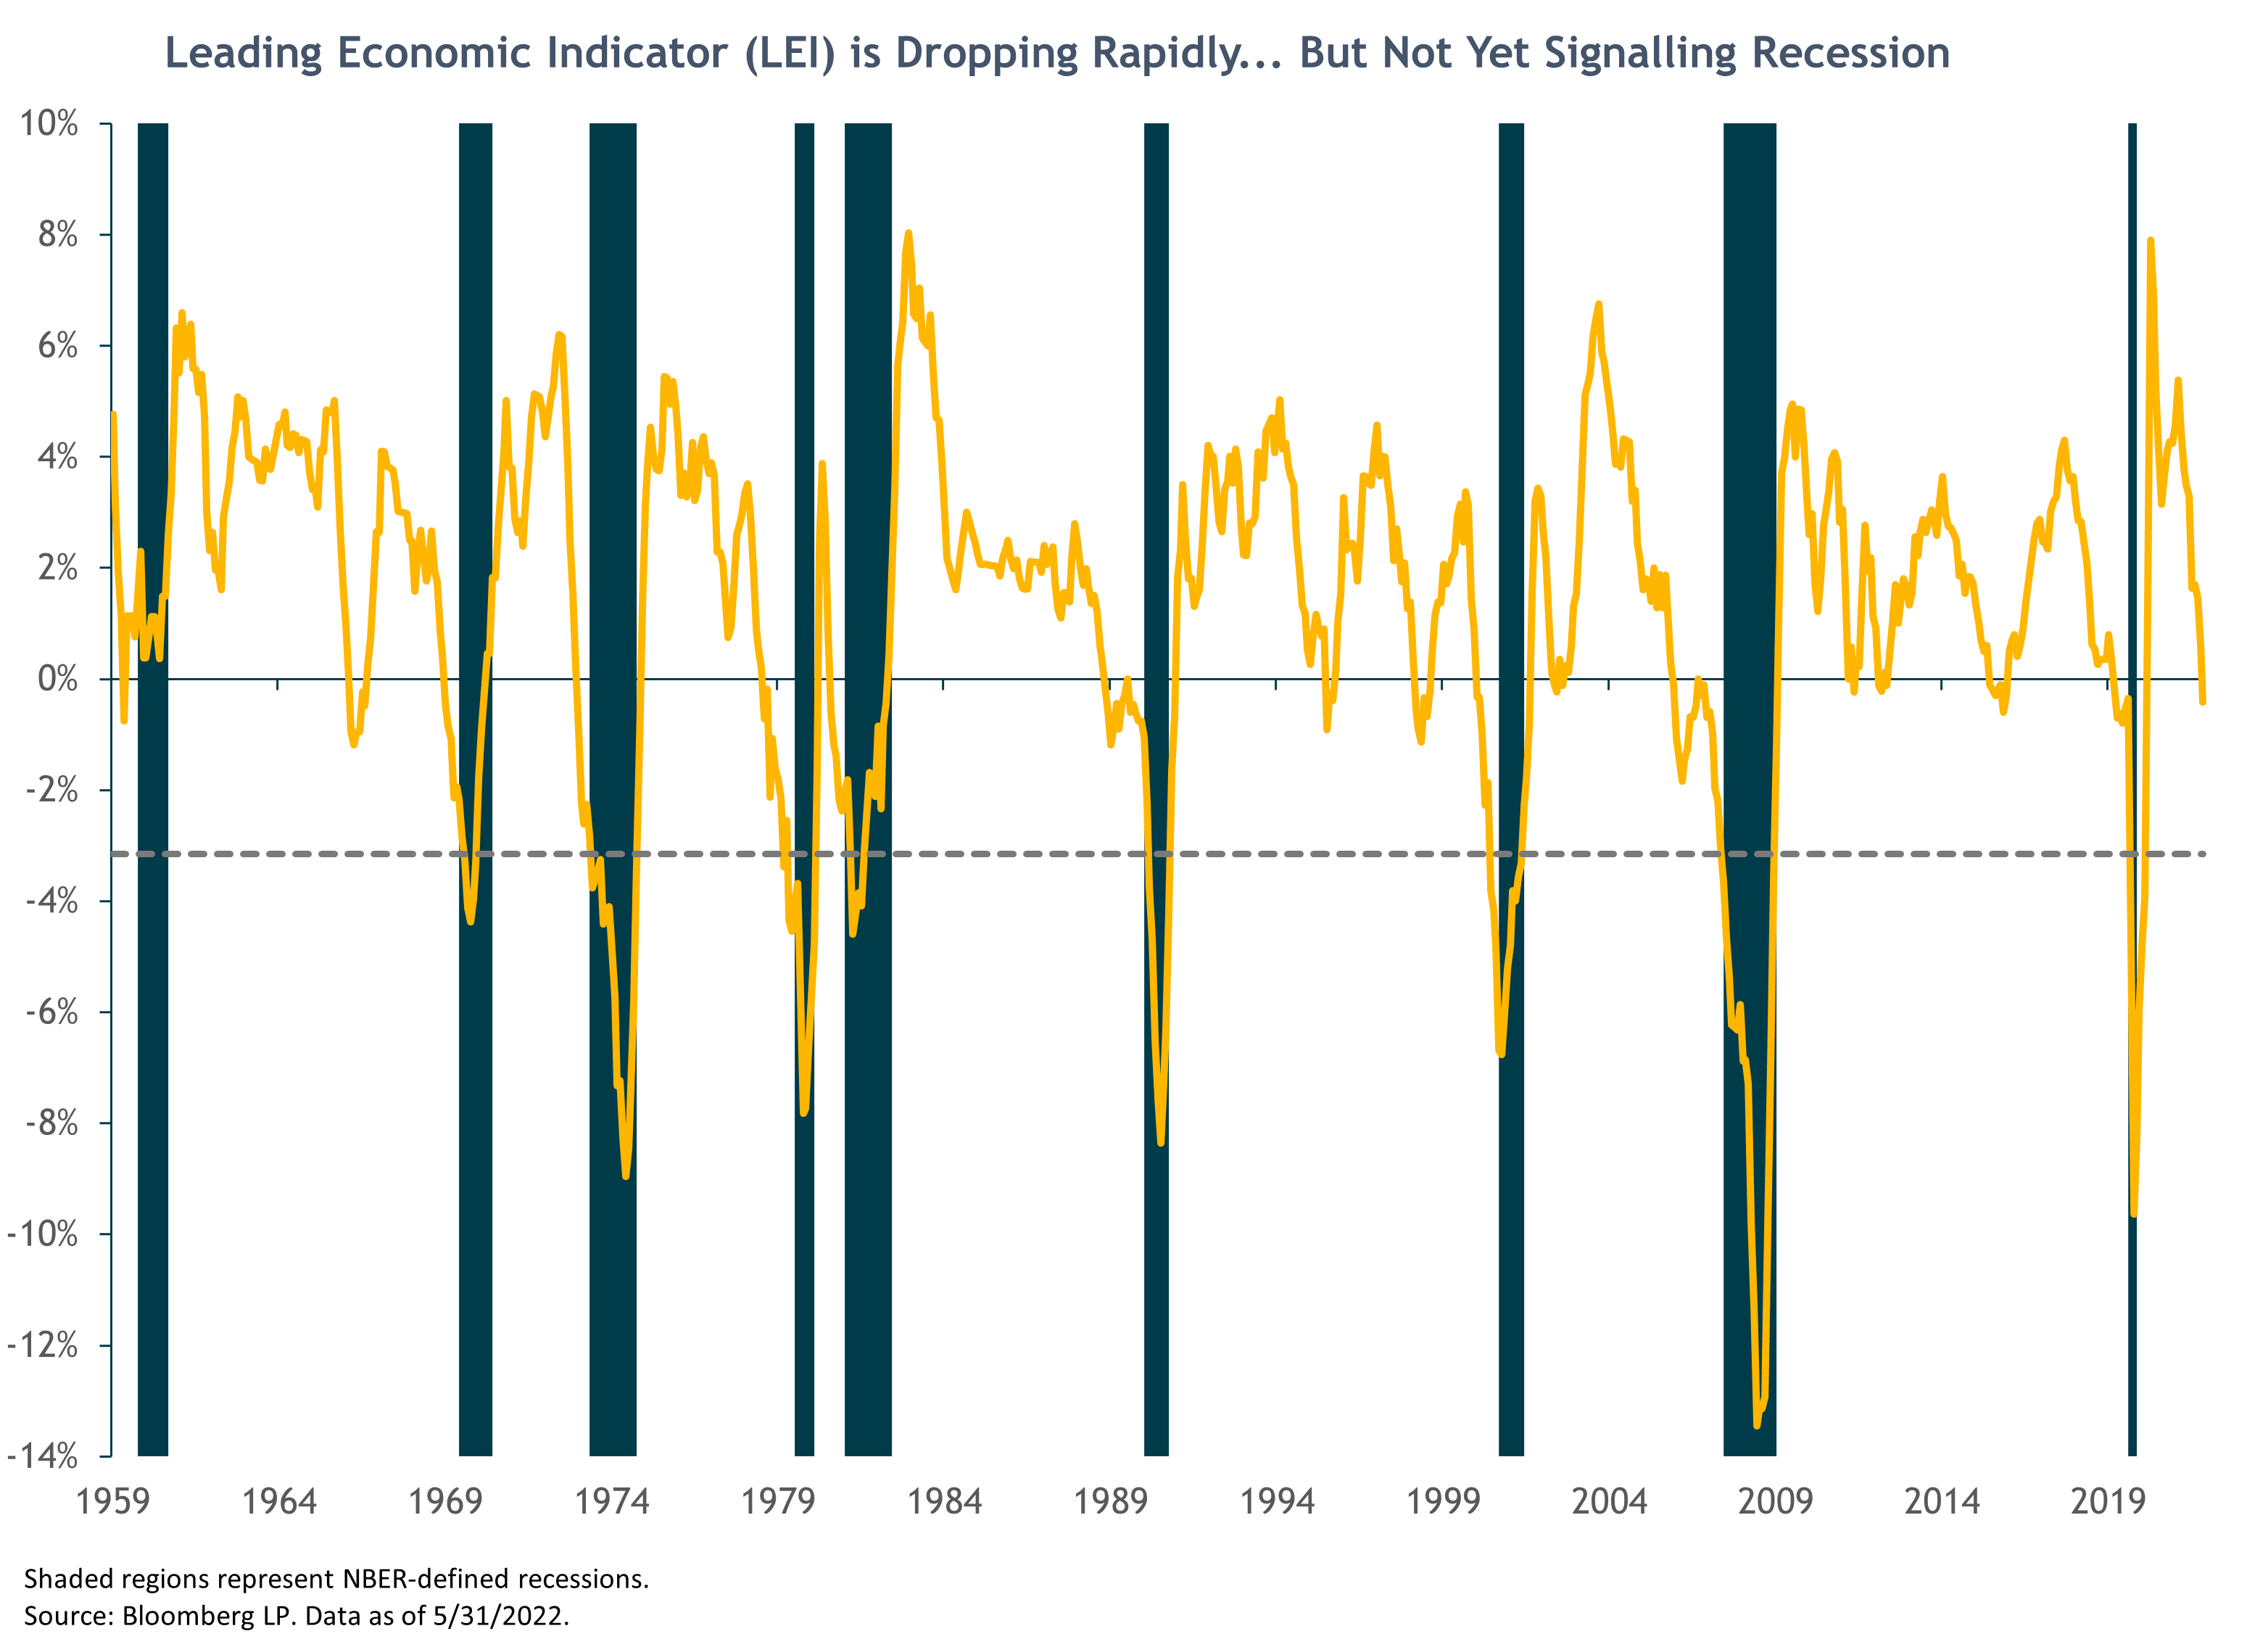
There is abundant evidence that economic growth is slowing in the U.S. and abroad. Two widely followed monthly indicators are the Conference Board’s Leading Economic Indicator (LEI) and the Purchasing Manager Indexes (PMI). They have both turned sharply lower — declining in each of the past three months — but still don’t (yet) indicate a recession is imminent, based on their typical historical relationship.
On the other hand (as all good two-handed economists like to say), there are also several important economic indicators that remain strong, including job growth (nonfarm payrolls increased 390,000 in May), a very low unemployment rate (3.6%), very low weekly new unemployment claims (though starting to move higher), and consumer and corporate balance sheets that can support additional spending and borrowing. Given this strength, a recession in the next year is not inevitable.
Looking outside the United States, the chart below shows that nearly 80% of global central banks have also been raising interest rates. This is the highest rate since just before the 2008 financial crisis. The notable exceptions continue to be the European Central Bank (ECB), the Bank of Japan (BOJ), and the Peoples Bank of China (PBOC). However, the ECB has essentially guaranteed it will begin hiking rates in July.
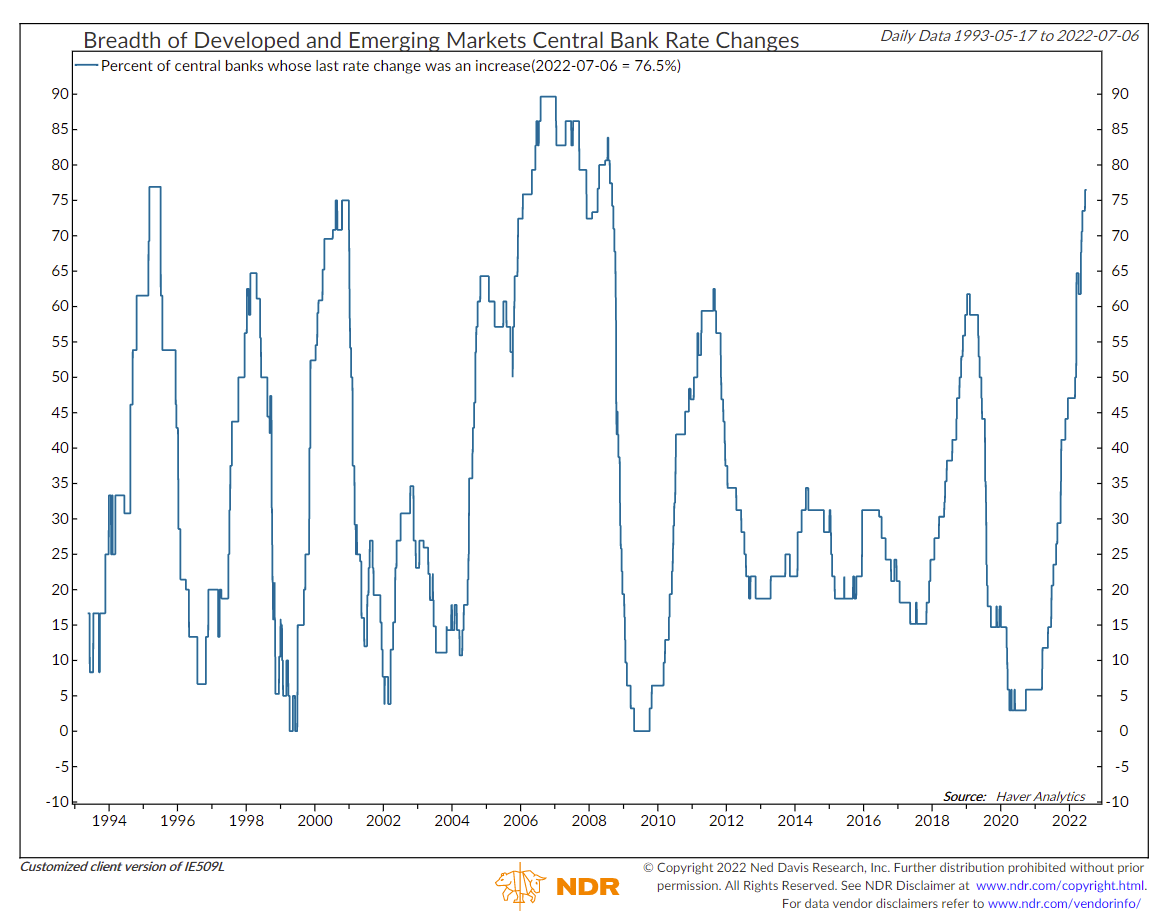
Most Global Central Banks are Raising Rates – except China and Japan
Meanwhile, the PBOC continues to modestly ease monetary and credit conditions in response to China’s sharp COVID-related growth slowdown this year. And, uniquely among global economies, inflation is not a concern; China’s latest headline CPI inflation rate was 2.1%, with core CPI inflation only 0.9%. Additional fiscal stimulus (e.g., infrastructure spending) and regulatory policy relief are also likely in China this year. Counterbalancing this stimulus is the ongoing wildcard of China’s “zero-COVID” policy restrictions. Weakening external (foreign) demand for Chinese manufactured goods and a fragile local property sector remain the other key macroeconomic risks for China’s economic growth this year.
Big picture, balancing these and many other data points, our base case shorter-term (6-to-12-month) economic outlook for the U.S. and global economy is for continued and potentially sharp deceleration in economic growth driven by rapidly tightening monetary policy in response to sustained high inflation. A recession is a reasonable conservative scenario but not a certainty. We are not economic forecasters (thankfully!). Much more relevant for us as portfolio managers and investment analysts is assessing the potential severity of any economic slowdown/recession and its impact on corporate earnings and interest rates, and what is being discounted in asset prices.
Our best guess at this point is that if the U.S. economy does fall into a recession, it is likely to be a more “normal” type of cyclical recession rather than like the 2008-09 financial crisis, the 2000-2002 dotcom bubble bust, or the 2020 COVID recession. Given the sharp stock and bond market declines we’ve already experienced this year, this leads us to a relatively positive medium-term (five-year) outlook for financial markets and asset class returns, as we’ll discuss next.
Financial Markets Outlook and Our Portfolio Positioning
In short, if U.S. stocks drop further this year – for example, due to increasing recession fears – we would add incrementally more to our equity allocations if their medium-term expected returns became sufficiently attractive. Alternatively, if we’ve already seen the market bottom for this cycle with the S&P 500 down 24% – for example, if the Fed engineers the fabled soft-landing – our current moderately “pro-risk” portfolio positioning should perform well in the recovery.
Nevertheless, one might ask why we are not tactically reducing our equity exposure, given we view the risk of recession as materially higher now than a few months ago. The answer is that we believe stock markets in the U.S. and abroad have largely already priced in this risk with year-to-date declines of 20%-30%.
As we’ve often stated: the key question for a fundamental investor is, “What’s in the price?” What consensus expectations and assumptions are implicitly being discounted in current market prices? Then we ask: “Do we have a different view from the consensus?” And if so, “Do we have conviction – based on our research, analysis and collective judgment – that we have a high probability of being right and the current market consensus reflected in current asset prices is wrong?”
If all those conditions are not met, we stay the course with our existing long-term, strategic portfolio allocations, confident that our portfolios have a well-diversified balance of defensive assets able to mitigate shorter-term negative outcomes or shocks, and riskier but higher-returning assets that are the portfolios’ primary long-term wealth builders.
We’ll focus here on our current assessment and outlook for global equities, and U.S. stocks in particular.
Equities
U.S. stocks
We’ll frame our discussion from three perspectives:
- What does history tell us about the typical loss and range of losses for the U.S. stock market (S&P 500) during bear markets and recessions? This provides useful context and helps inform our shorter-term downside risk assessment.
- What does history tell us about market recoveries after 25% bear market losses?
- What is our current base case five-year expected return for the S&P 500 based on our forward-looking fundamental analysis?
- History of typical bear market losses and worst cases
Post-WWII market history shows the average S&P 500 bear market has lost roughly 30%; the median loss is 27%. (Note: In the table below we are defining bear markets as market drawdowns of 19% or more. There have been four bear markets with losses between 19% and 20%, and 13 bear markets down 20% or more. If we strictly count only 20%+ bear markets, the average post-WWII bear market loss is 33% and the median is 31%.)
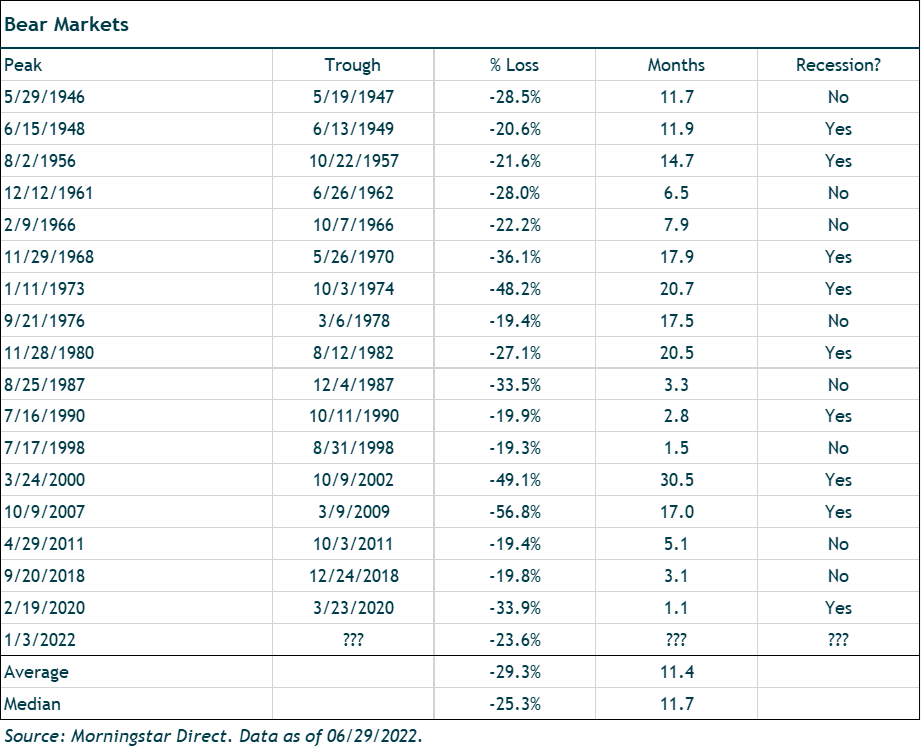
In bear markets associated with recessions the average loss has been somewhat worse at 35%, with the median loss 34%. So when the S&P was down 24%, at its 3,667 closing price level on June 16, one could argue the market was discounting roughly a 70% probability of an average recession (assuming the remaining probabilities for more positive and more negative scenarios roughly canceled each other out). The average 35% recessionary bear market decline from the S&P 500’s high of 4,800 would bring the S&P 500 down to 3,120; 70% of 35% is 24%, or 3,667.
Our confidence about the likelihood of an oncoming recession or its severity is not sufficiently high nor different from the consensus-weighted 70% probability. So, we have not made a tactical move to reduce our stock exposure based on a recession bet.
As shown in the table, the worst bear market in post-WWII history was during the Great Financial Crisis of 2008-09 when the market fell 57% from its October 2007 high to its March 2009 low. A repeat of that type of decline can’t be categorically ruled out, but there is little evidence the economy and markets are facing anywhere near that level of systemic financial risk and rot in the current circumstances.
The same goes for comparisons to the 1973-74 decline of 48%, although there are some current echoes with that period’s OPEC oil price shock and the dominance and subsequent crash of the Nifty Fifty “growth at any price” stocks (e.g., compared to the “FAANG” stocks now). However, we think the differences are more compelling: such as, the current tightening fiscal and monetary policy stance, more reasonable equity valuations relative to bond yields, stable longer-term inflation expectations, lack of a wage-price spiral (so far), and the absence of a presidential scandal and resignation (Watergate-Nixon).
Yes, we face plenty of other problems now that weren’t around back in the 1970s or 2008. But rather than assume an extreme negative risk scenario will play out, we expect this to be a more typical cyclical recession, where central bank (and fiscal) tightening in response to an overheating economy and rising inflation ultimately trigger a bear market and economic downturn.
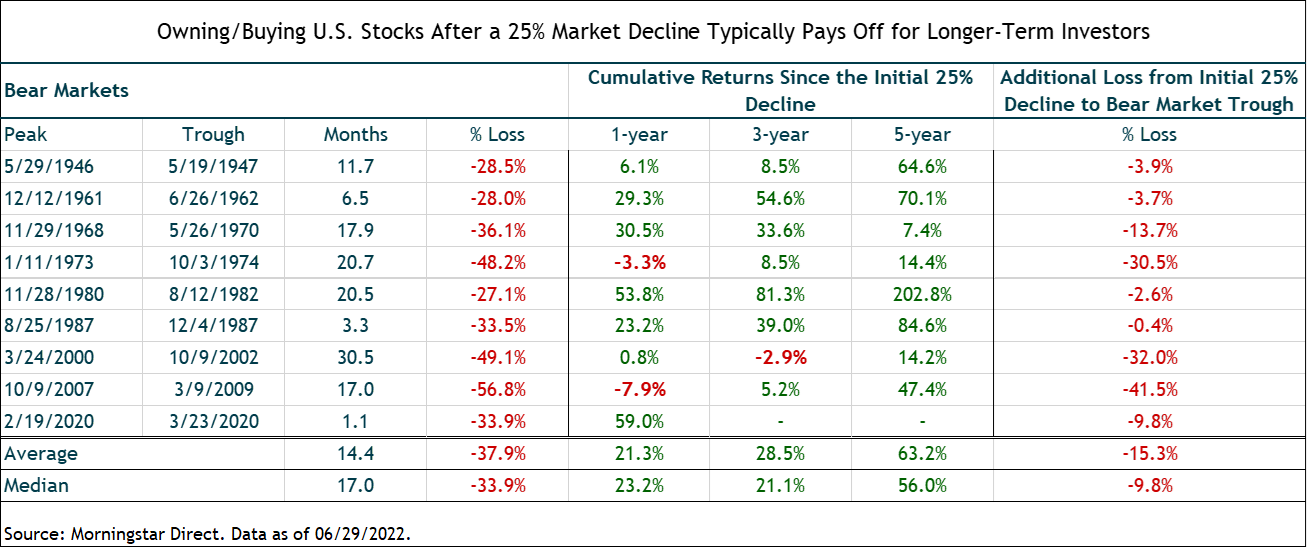
- History of market recoveries after bear market declines
If so, that should set the stage for a subsequent cyclical recovery. And here again history can be a useful reference and reality check. We looked at all the U.S. bear markets since WWII and calculated the forward 1-, 3- and 5-year returns of the S&P 500 starting from the date when it was down 25%, under the assumption that if we do have a recession soon the market will take another leg down from here and we will start tactically adding to our U.S. equity exposure.
There are not a lot of data points, but we think the following table supports prudent optimism for disciplined investors. On average, the market was 21%, 29% and 63% higher, one-, three- and five-years later.
The table also shows the additional losses the market suffered after the initial 25% decline on its way to its ultimate bottom. There’s no denying the range of outcomes is very wide, with a few sub-par outcomes during the extreme bear market periods. That is the reality of investing in stocks – they can be quite volatile and incur large short-term drawdowns. But in exchange for bearing that risk and that discomfort, they have historically provided substantially higher long-term returns than lower-risk asset classes.
- Our forward-looking tactical analysis for U.S. stocks
We believe the most likely catalyst for another leg down in U.S. stocks –- outside of another negative inflation surprise — is disappointing corporate earnings growth. It’s striking that while forecasts for economic growth have dropped sharply this year, S&P 500 earnings growth forecasts for 2022 have actually moved higher, rising from just under 9% (bottom-up operating earnings) at the beginning of the year to nearly 11% today. Earnings are expected to grow another 10% in 2023. But historically, during the 12 recessions since WWII, S&P 500 earnings dropped by a median of 13% from peak to trough.
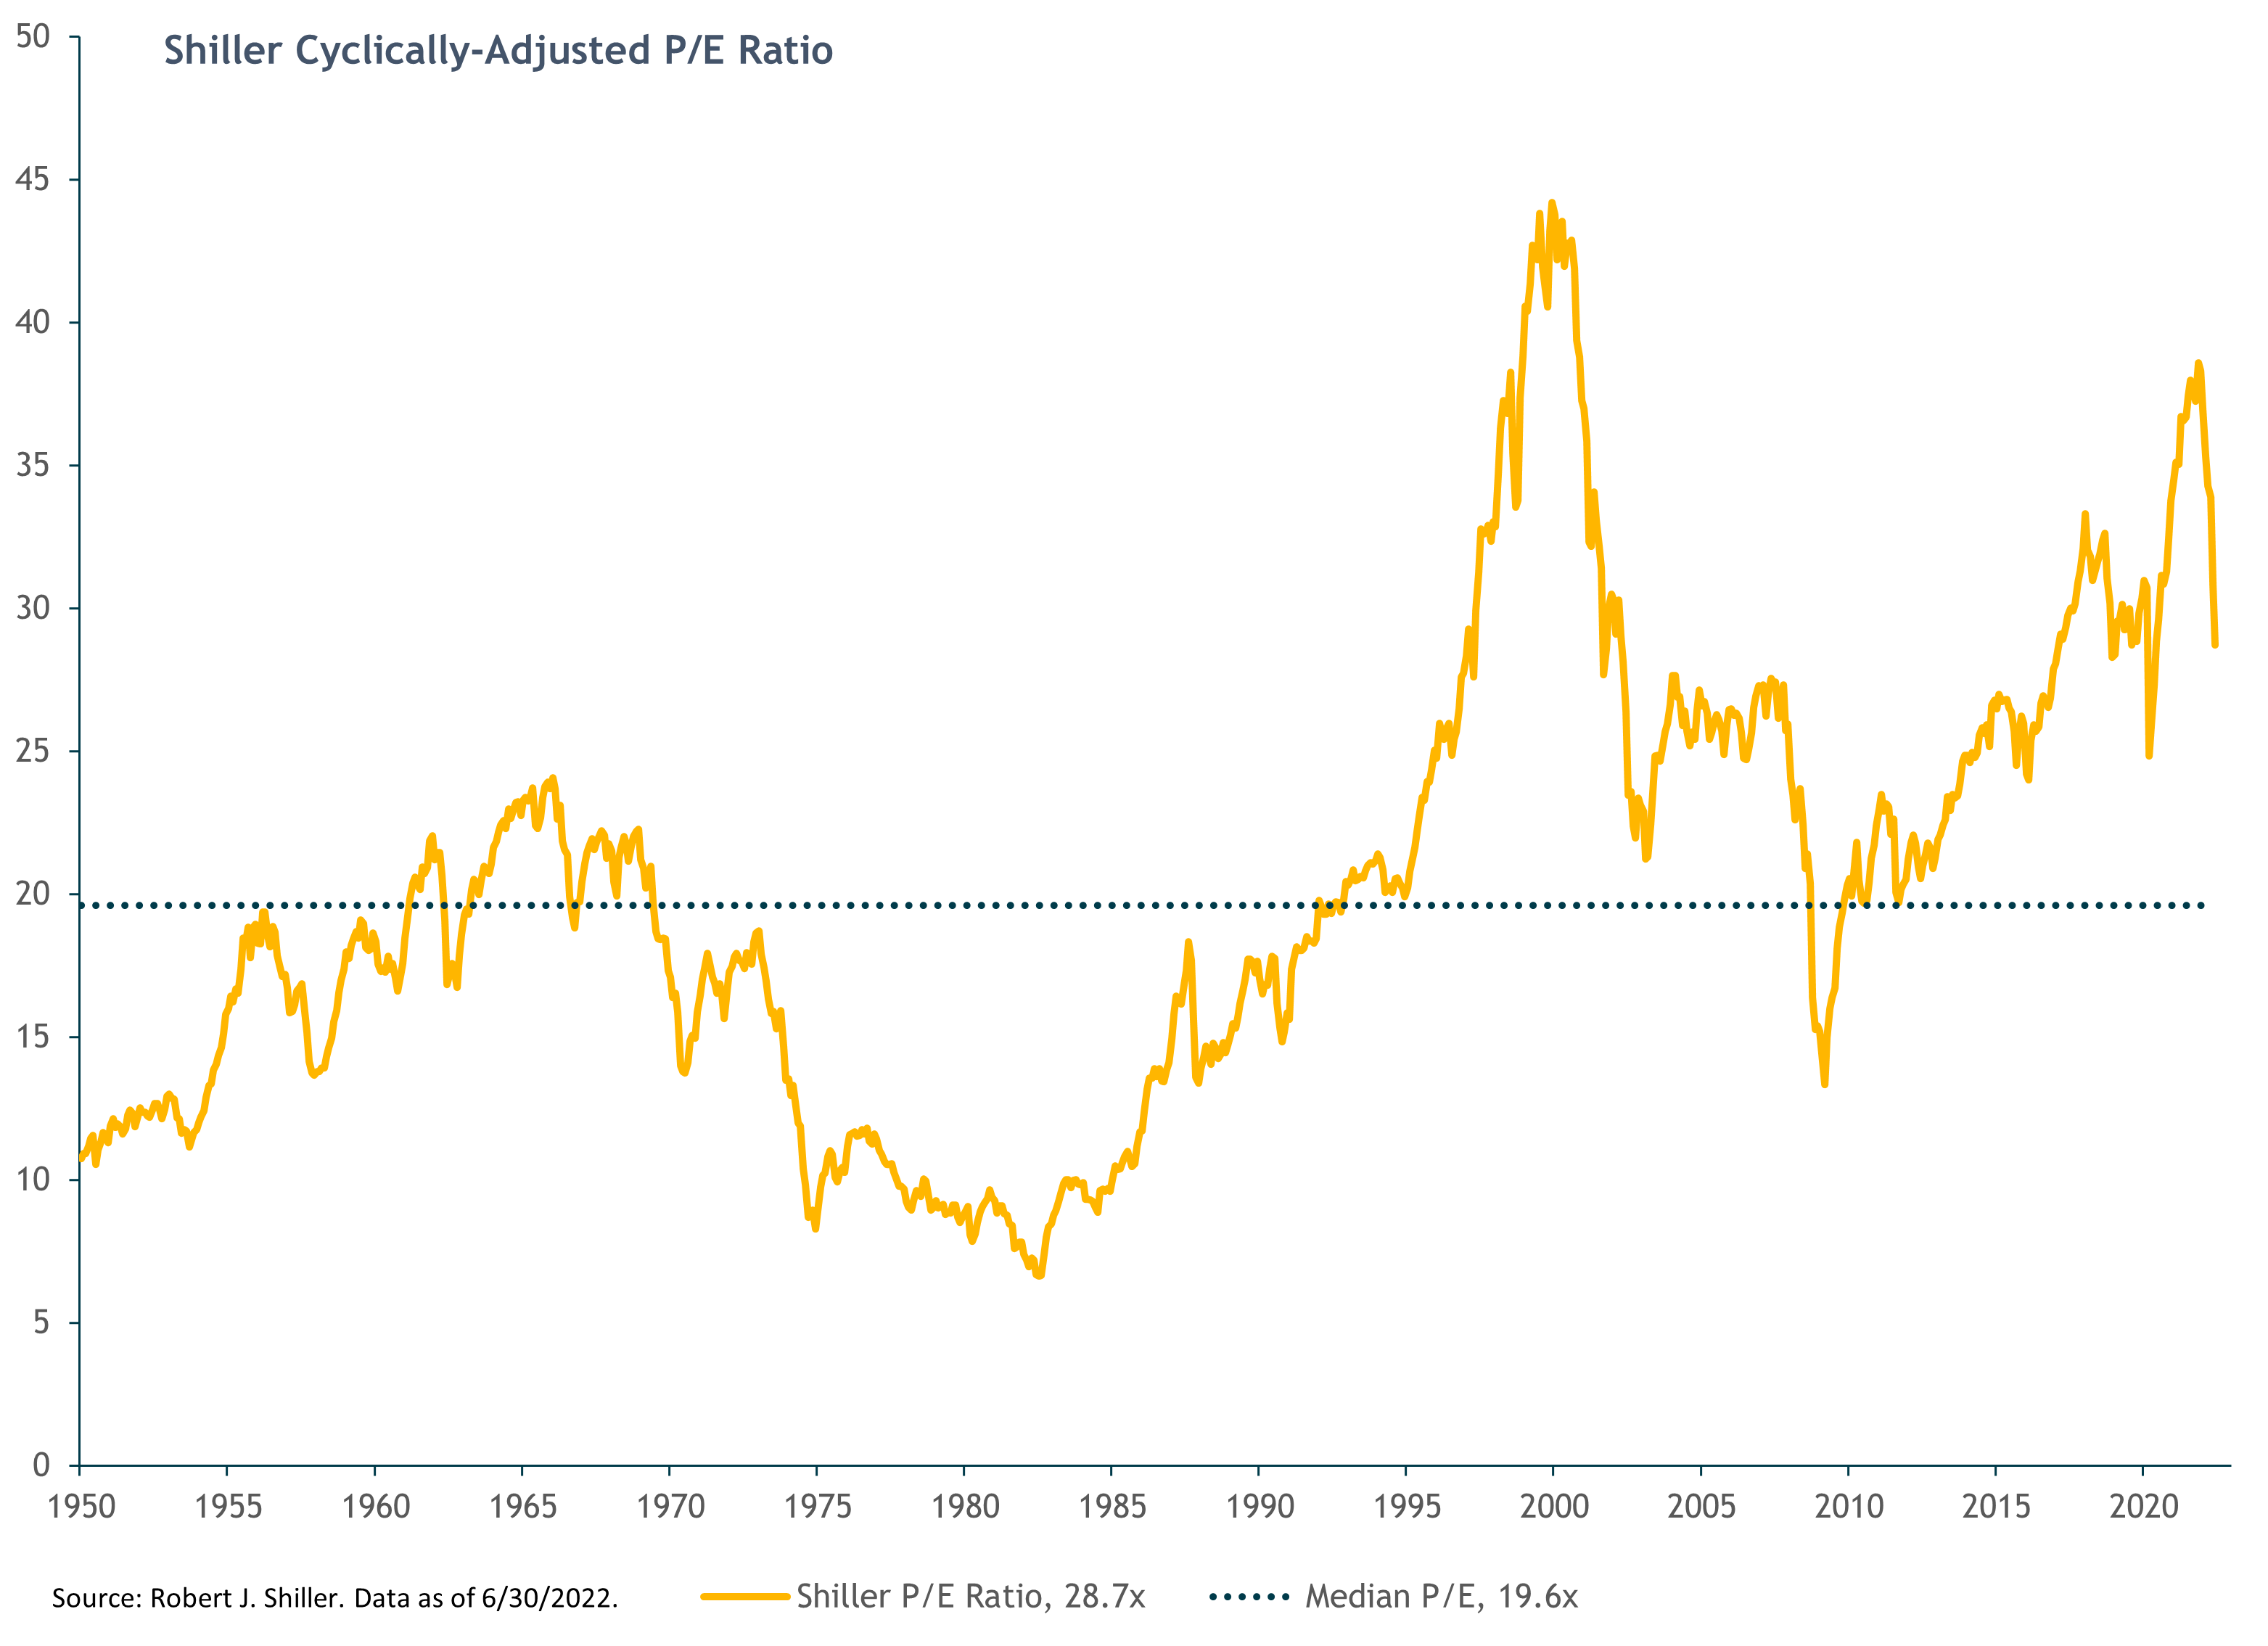
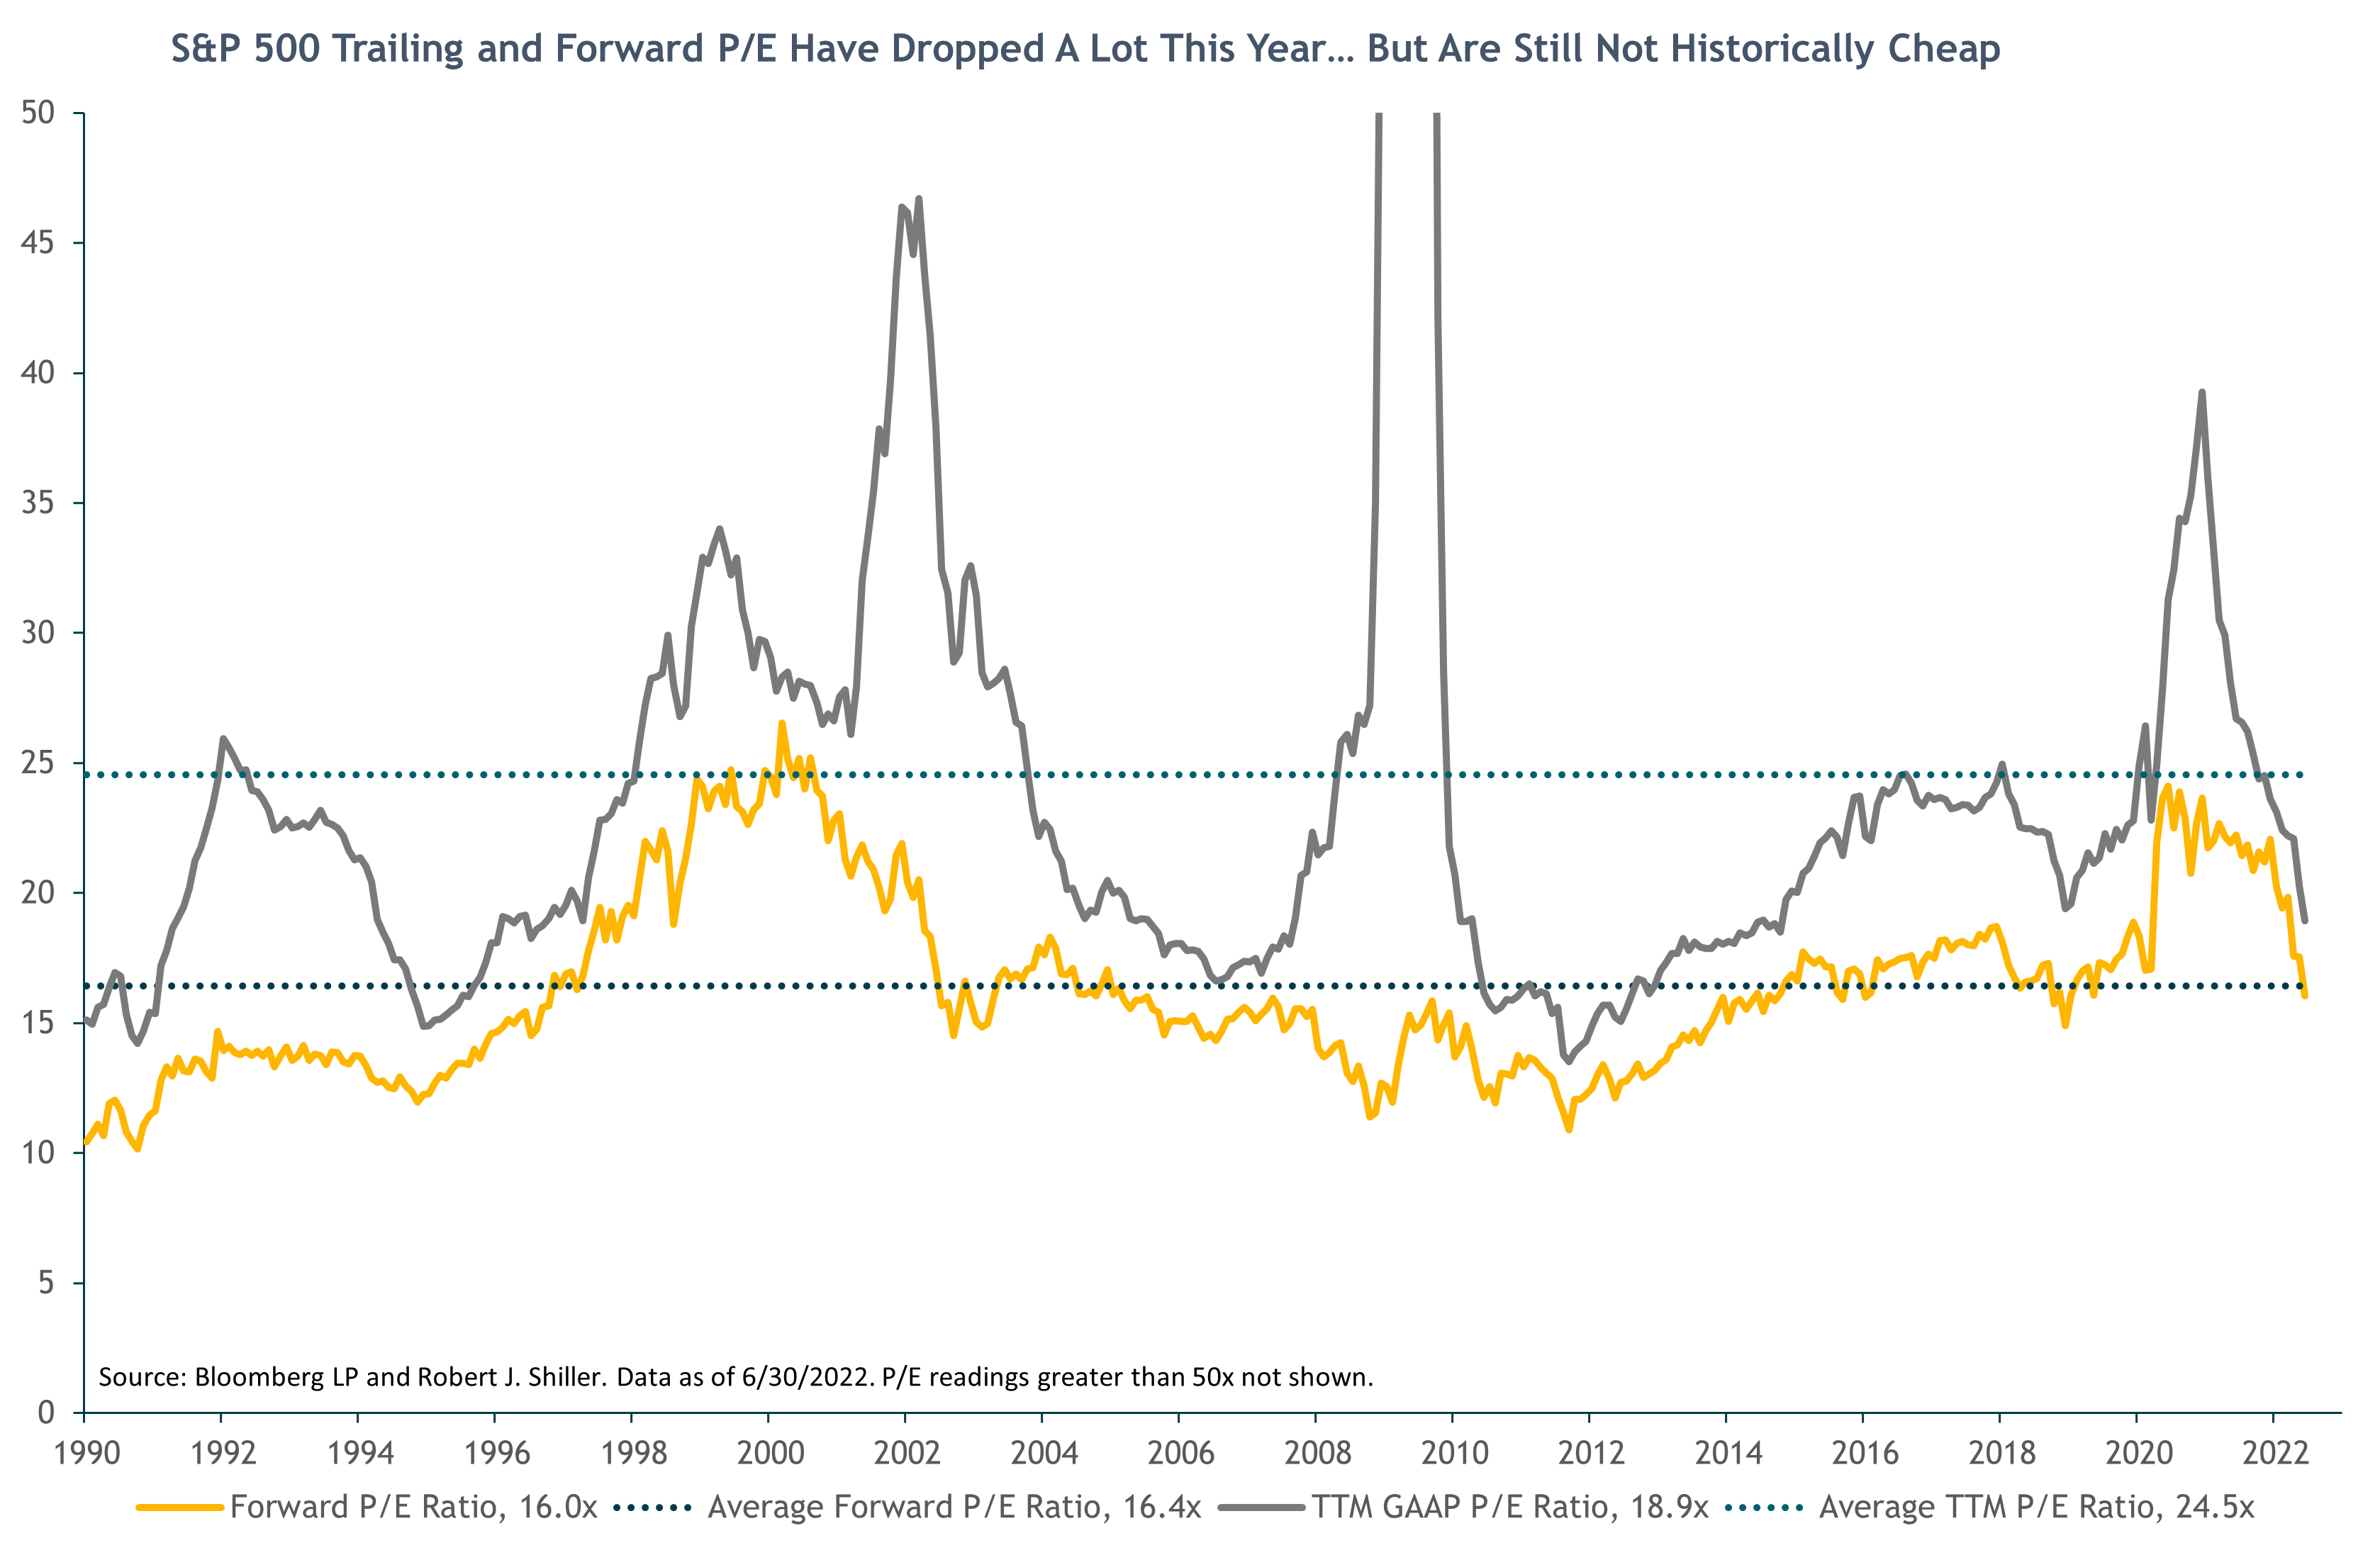
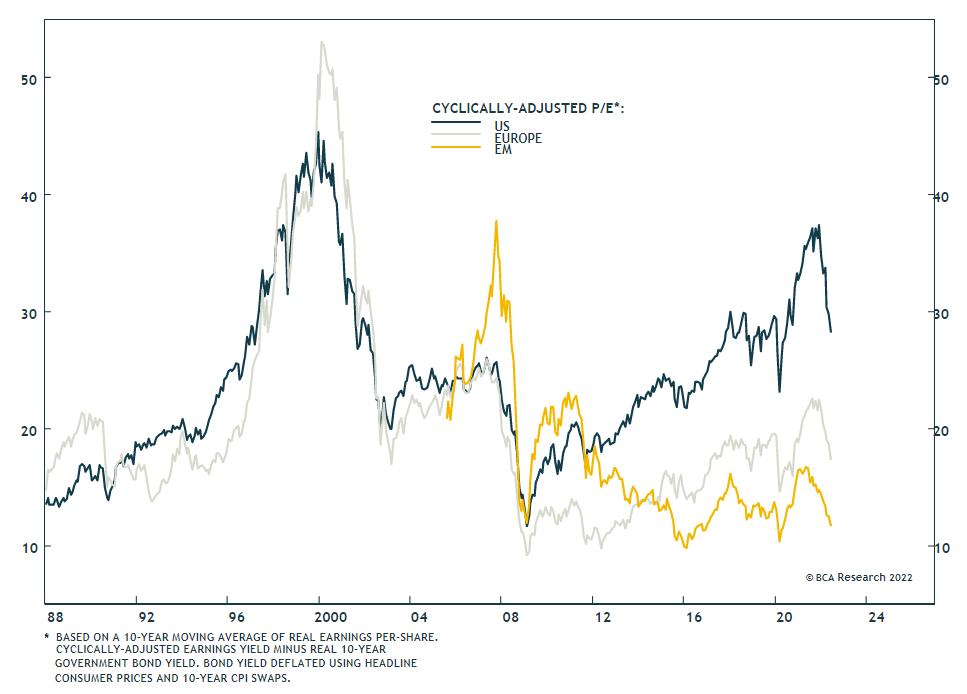
The entire drop in the S&P 500 this year (and then some) has been due to valuation compression, i.e., a sharp decline in the “P” of the market’s P/E (price/earnings) ratio. Earnings have grown while the market price level has declined. This has caused a nearly 30% reduction in the market’s 12-month forward P/E ratio, one of the sharpest valuation compressions on record. The “valuation risk” that we have been discussing for the past several years has finally come home to roost.
This is good news as it provides a better (lower) valuation base from which to compound returns looking out over the next five years; valuation should be much less of a medium-term return headwind, or no headwind at all, from current levels.
Lower valuations may also provide somewhat of a cushion, or margin of safety, if S&P earnings disappoint current expectations, although absolute market valuations are still not historically cheap by any means and could easily drop further in this bear market.
Our base case five-year expected return range for U.S. stocks
Our understanding of financial market history informs our forward-looking qualitative analysis and quantitative modeling of U.S. stock returns. In our approach, we consider a range of scenarios involving different assumptions for the key variables in our expected returns model. The key variables being earnings growth (derived from revenue growth and profit margin estimates), interest rates, and valuation (P/E) multiples.
We also conduct sensitivity analysis within each scenario to derive a “base case” five-year expected return range for the S&P 500, as well as upside and downside scenarios that we believe are lower likelihood than the base case but not extreme outliers.
As we write this in late June (with the S&P 500 around 3900), our base case five-year expected return range for the S&P 500 is 7% to 12%, annualized. This compares to the roughly 3% to 8% expected return range at the end of the first quarter.
A 7%-12% return range is in line with our long-term (10 to 20+ year) return expectations for U.S. stocks. And it offers an attractive premium above the expected returns for core bonds. This explains why we have a full (neutral) allocation to U.S. stocks currently.
But these expected returns are not (yet) compelling enough for us to tactically add to our U.S. stock exposure. All else equal, we’d be looking to do that if the market drops another 10% or so from current levels. At that point we would be getting well-compensated for the short-term equity market risk via very attractive medium-term expected returns.
More precisely, in that event, the mid-point of our base-case expected return range would imply a roughly 80% cumulative five-year return. (This is higher than the average five-year return in the historical table above.) If the market dropped even further, we’d incrementally increase our equity exposure further, assuming no material changes in our key modeling assumptions or outlook.
Developed International and Emerging Markets (“EM”) Stocks
Our tactical views and positioning on international and EM stocks have not changed. These markets have declined largely in line with the U.S. market this year, with EM doing a bit better.
Our base case five-year expected returns for EM and developed international stocks are in the low double digits, supported by low starting valuations and cyclically depressed earnings. This offers a margin of safety for investors, as a lot of bad news and negative sentiment is already priced into these markets, more so than for the S&P 500 in our view. Things don’t have to become absolutely great for international and EM stocks to generate strong returns from here; they just need to get better from currently depressed levels. From a macro perspective, pandemic and war have not helped these markets. But we don’t view those shocks as a permanent state of affairs.
Having appreciated more than 9% this year versus a basket of other currencies, U.S. dollar strength remains a substantial headwind for foreign stock returns to dollar-based investors. The strong dollar has been a function of Fed hawkishness, rising U.S. interest rates and global growth fears. To the extent these trends continue, we’d expect the dollar to remain strong. However, we expect the dollar to reverse course once U.S. inflation readings decline enough for the Fed to signal it is at least relaxing its foot on the monetary policy brakes, if not taking it off completely. That monetary policy easing signal may also be the catalyst for a broad global equity rally and potentially mark the bottom of the bear market.
In that case, we would expect EM and developed international stocks to outperform the S&P 500, boosted not only by the tailwind of a depreciating dollar but also by those markets’ generally higher sensitivity (beta) to cyclical global economic conditions compared to the US market.
China remains a key driver of overall EM economic and equity market performance. As noted earlier, China is in a unique position due to its low inflation rate to be able to ease monetary/credit policy and take other steps (e.g., infrastructure spending) to boost its economy and financial markets. We expect these stimulus measures to continue throughout the year. This should help support EM markets more generally, but likely won’t be enough on their own to trigger an EM market rally without a Fed policy pivot and reversal in the U.S. dollar.
Fixed Income
Coming into the year, we had been expecting interest rates to rise, putting continued pressure on core bond returns. That played out again in the second quarter, and fixed-income returns were negative across the board.
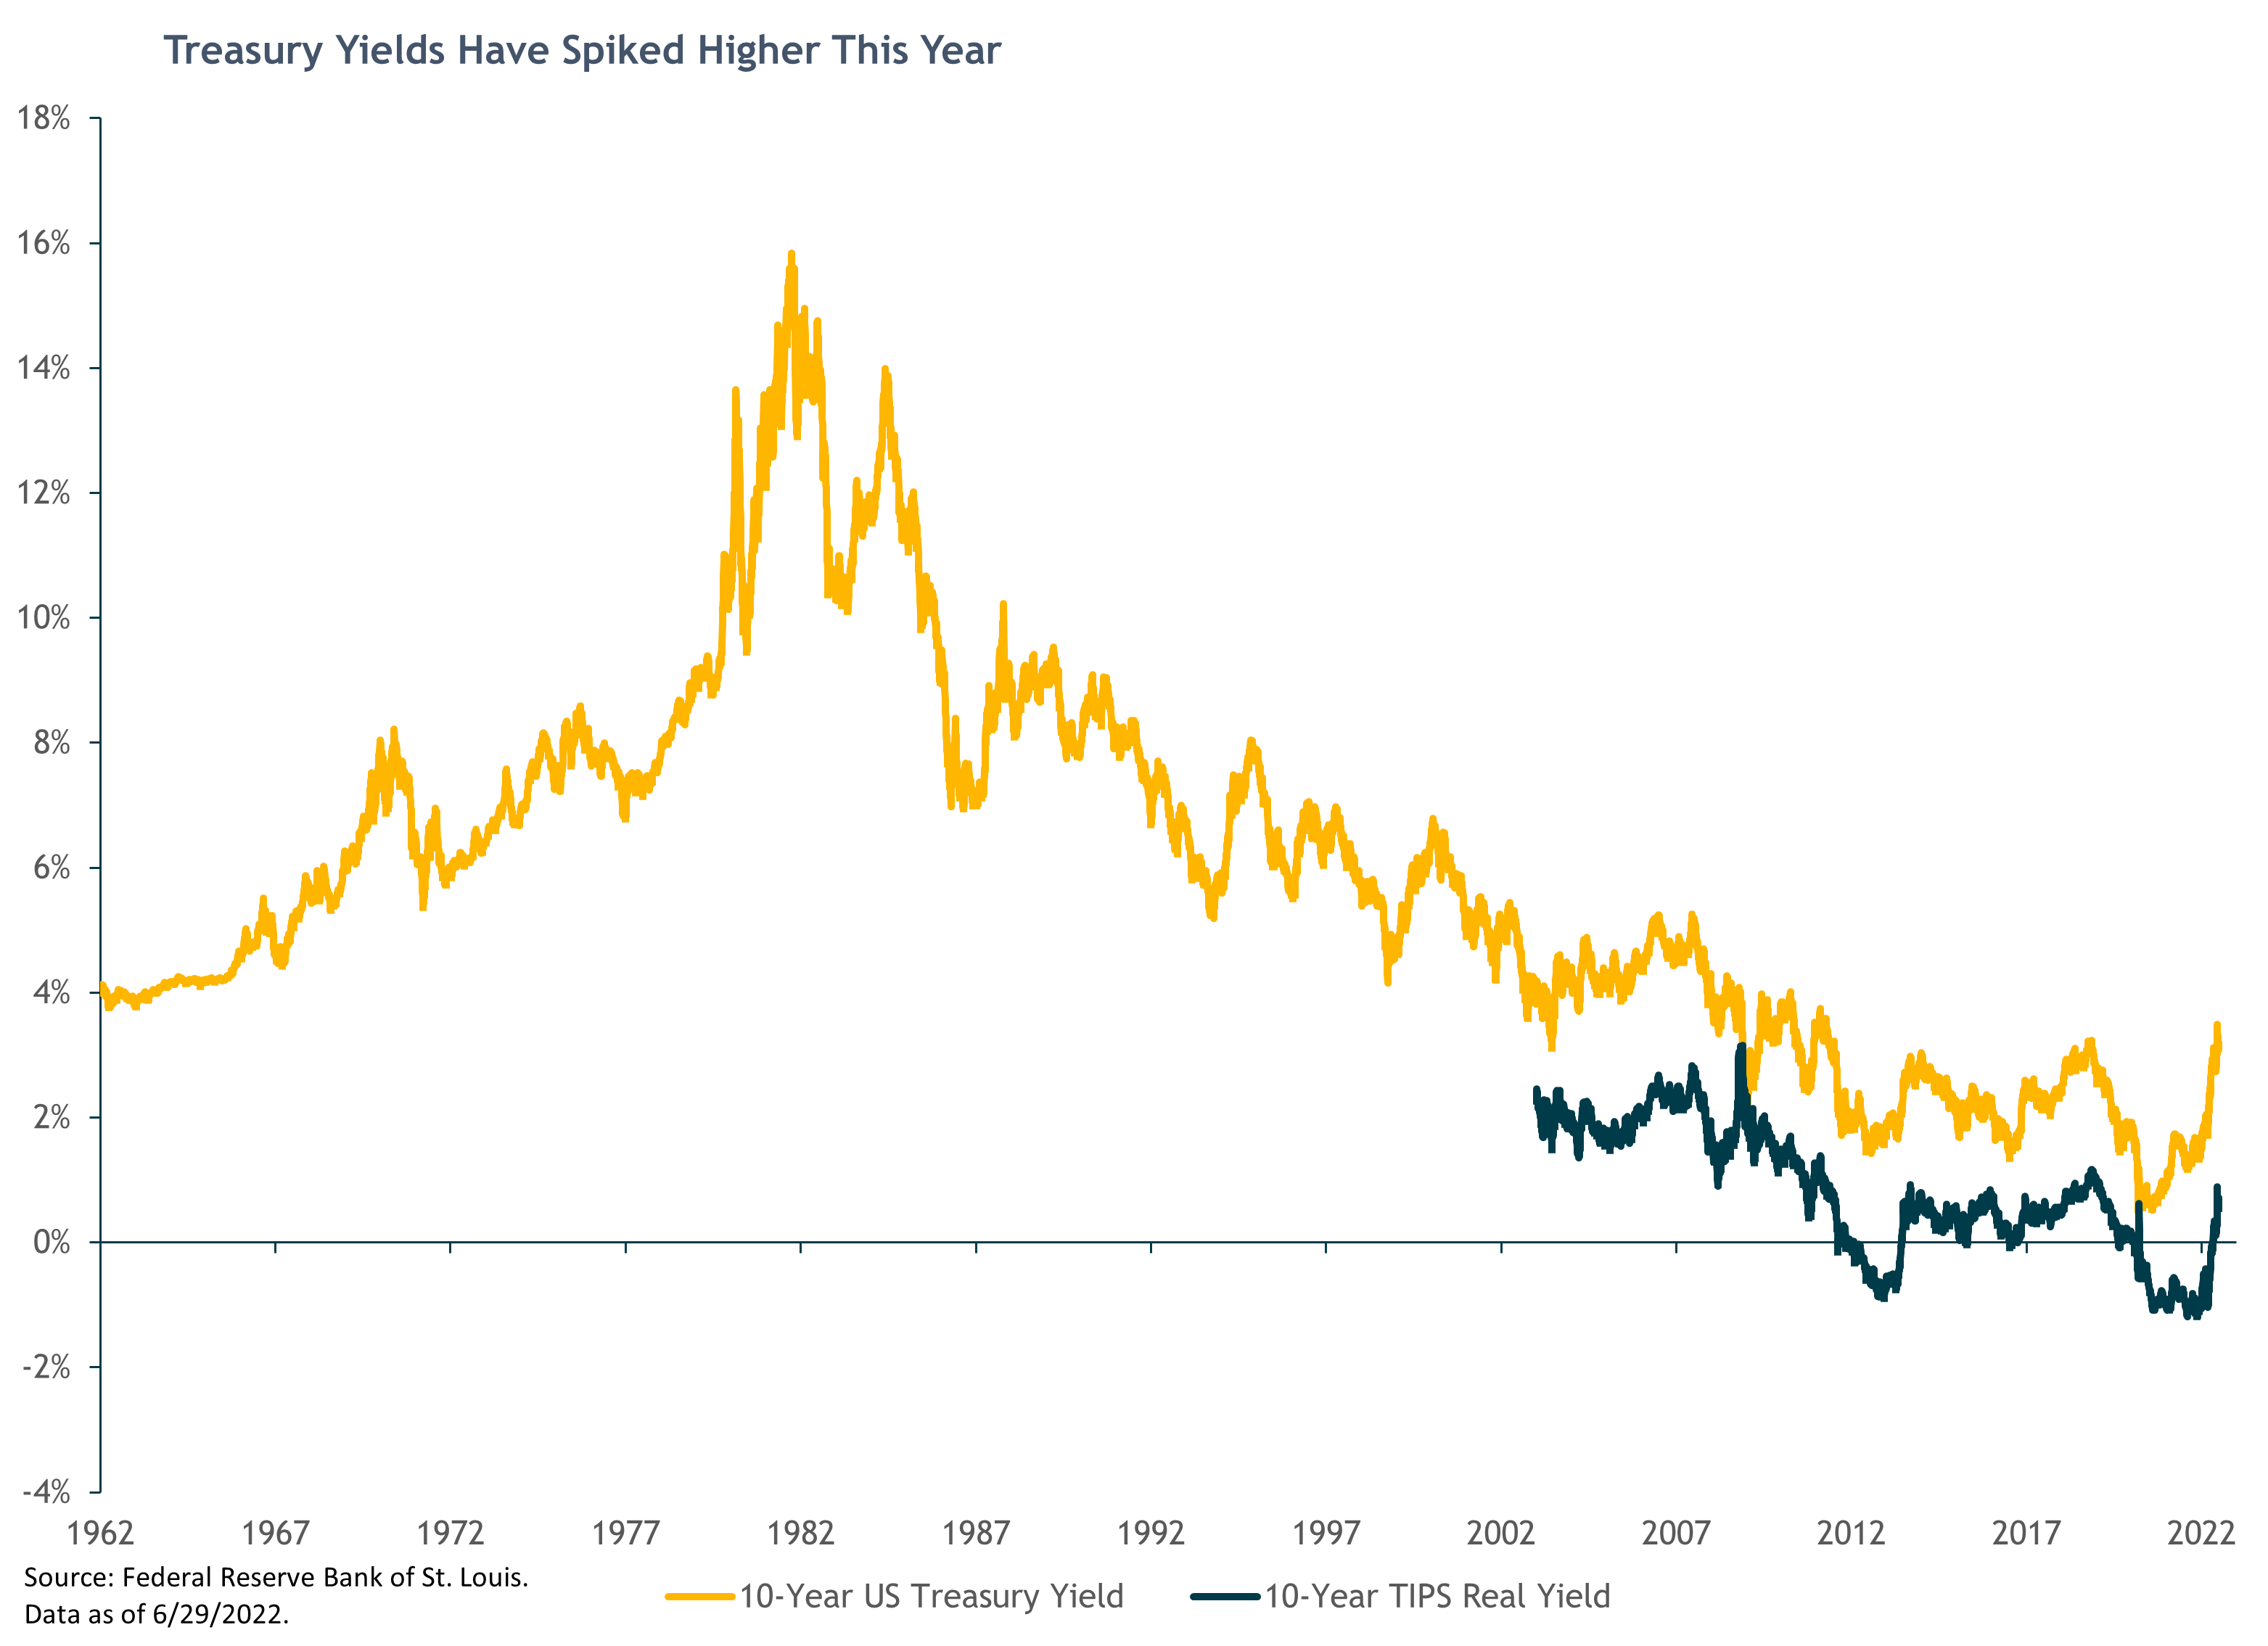
The benchmark 10-year Treasury yield rose from 2.3% at the end of March, peaked at 3.5% on June 14, and ended the quarter at 2.98%. Incredibly, the June high marked the highest 10-year Treasury yield since April 2011 (the same year Siri was first added to the iPhone 4S).
The recent losses for the bond market are painful, but the good news for investors is declining prices result in higher yields and higher future expected returns. We can’t rule out further shorter-term price declines, but at current yield levels the return potential for bonds has increased to attractive levels across most areas of fixed-income and appear to be pricing in some degree of negative outcomes. For example, core bonds (the Agg) at the end of the second quarter are yielding approximately 3.7%, levels not seen since the fourth quarter of 2018, and prior to that, late 2009.
In terms of our fixed-income positioning in our balanced portfolios, we have maintained our significant underweight to traditional core bonds, reflecting our concerns about rising interest-rates and very low starting yields. The fixed-income strategies we own have less interest-rate sensitivity (lower duration) and wide investment opportunity sets, providing flexibility to navigate interest-rate and credit cycles. Their yields also offer a nice income premium over the core bond index.
Though our fixed-income exposure has had better relative performance as interest rates have shot higher, they have not been immune to the recent broad fixed income price declines. They also carry more credit risk than the Agg. As such, in our more conservative portfolios we still retain meaningful core bond exposure for their traditional role as recession/dis-inflation protection.
Looking ahead, we continue to evaluate the evolving macro backdrop and swiftly changing valuation dynamics across the fixed-income landscape. Our goal is to balance near-term risk management in a period where growth and inflation uncertainty is elevated and potential 12-month returns are wide, with longer-term return potential and portfolio diversification benefits.
Alternative Assets and Strategies: Marketable and Private
Well-managed alternative strategies with reasonable fees can add beneficial diversification and improve risk-adjusted returns as part of traditional stock/bond balanced portfolios. Alternative investments (“alts”) have different risk and return drivers than traditional stock and bond investments. Given the current macro risks and market backdrop, we think they are especially valuable.
Most of our private client portfolios (depending on individual client circumstances and risk profile) hold a mix of marketable/liquid alts and private investments focused on real estate investments as well as private equity/venture capital.
The marketable alts include trend-following managed futures funds and multi-alternative strategy funds that include long-short credit, arbitrage, event-driven and opportunistic income strategies, among others. In our clients’ portfolios, we fund the allocation to marketable alts largely from core bonds. We expect higher long-term returns from our alternative strategies with low beta or correlation to equities and bonds. As expected, the managed futures positions have been powerful portfolio diversifiers. In the second quarter, as in the first, they have been positive, while traditional stock and bond investments were deep in the red.
Our private real estate investment allocations are funded from a mix of stocks and bonds, depending on our assessment of the real estate fund’s risk profile. We expect equity-like long-term returns from these investments, with some built-in inflation protection and income generation. The private equity/venture capital allocations are funded one-for-one from our strategic public equities allocation. These carefully selected actively managed private equity funds have the highest long-term expected returns, but also come with the highest return variability and illiquidity (requiring 10+ year holding periods).
Closing Thoughts
Without rehashing everything we wrote above, we think odds are there’s more downside for the stock market yet to come over the next several months or quarters. If further declines happen and reach our target, we will add incrementally to U.S. stocks at lower prices and higher expected returns.
On the other hand, if the economy avoids recession (for now) and the markets rebound, we are well-positioned to benefit with our full allocation to equities and large allocation to actively managed credit-oriented fixed income relative to core bonds.
Our balanced portfolio target allocations remain positioned with (1) a small overweight to global equities, coming from our tactical overweight to EM stocks; (2) a large position in flexible, actively managed, credit-oriented fixed-income funds; (3) core positions in alternative strategies; and (4) a large underweight to core bonds (relative to a traditional 60/40 stock/bond benchmark).
While tilting towards our highest-conviction tactical views, our portfolios remain strategically balanced and well-diversified across multiple global asset classes, investment strategies, equity styles and risk-factor exposures.
We sincerely appreciate your continued confidence and trust.
—Jeremy DeGroot, CFA, Chief Investment Officer