Year-End 2022 Investment Commentary
Fourth Quarter and 2022 Market Recap
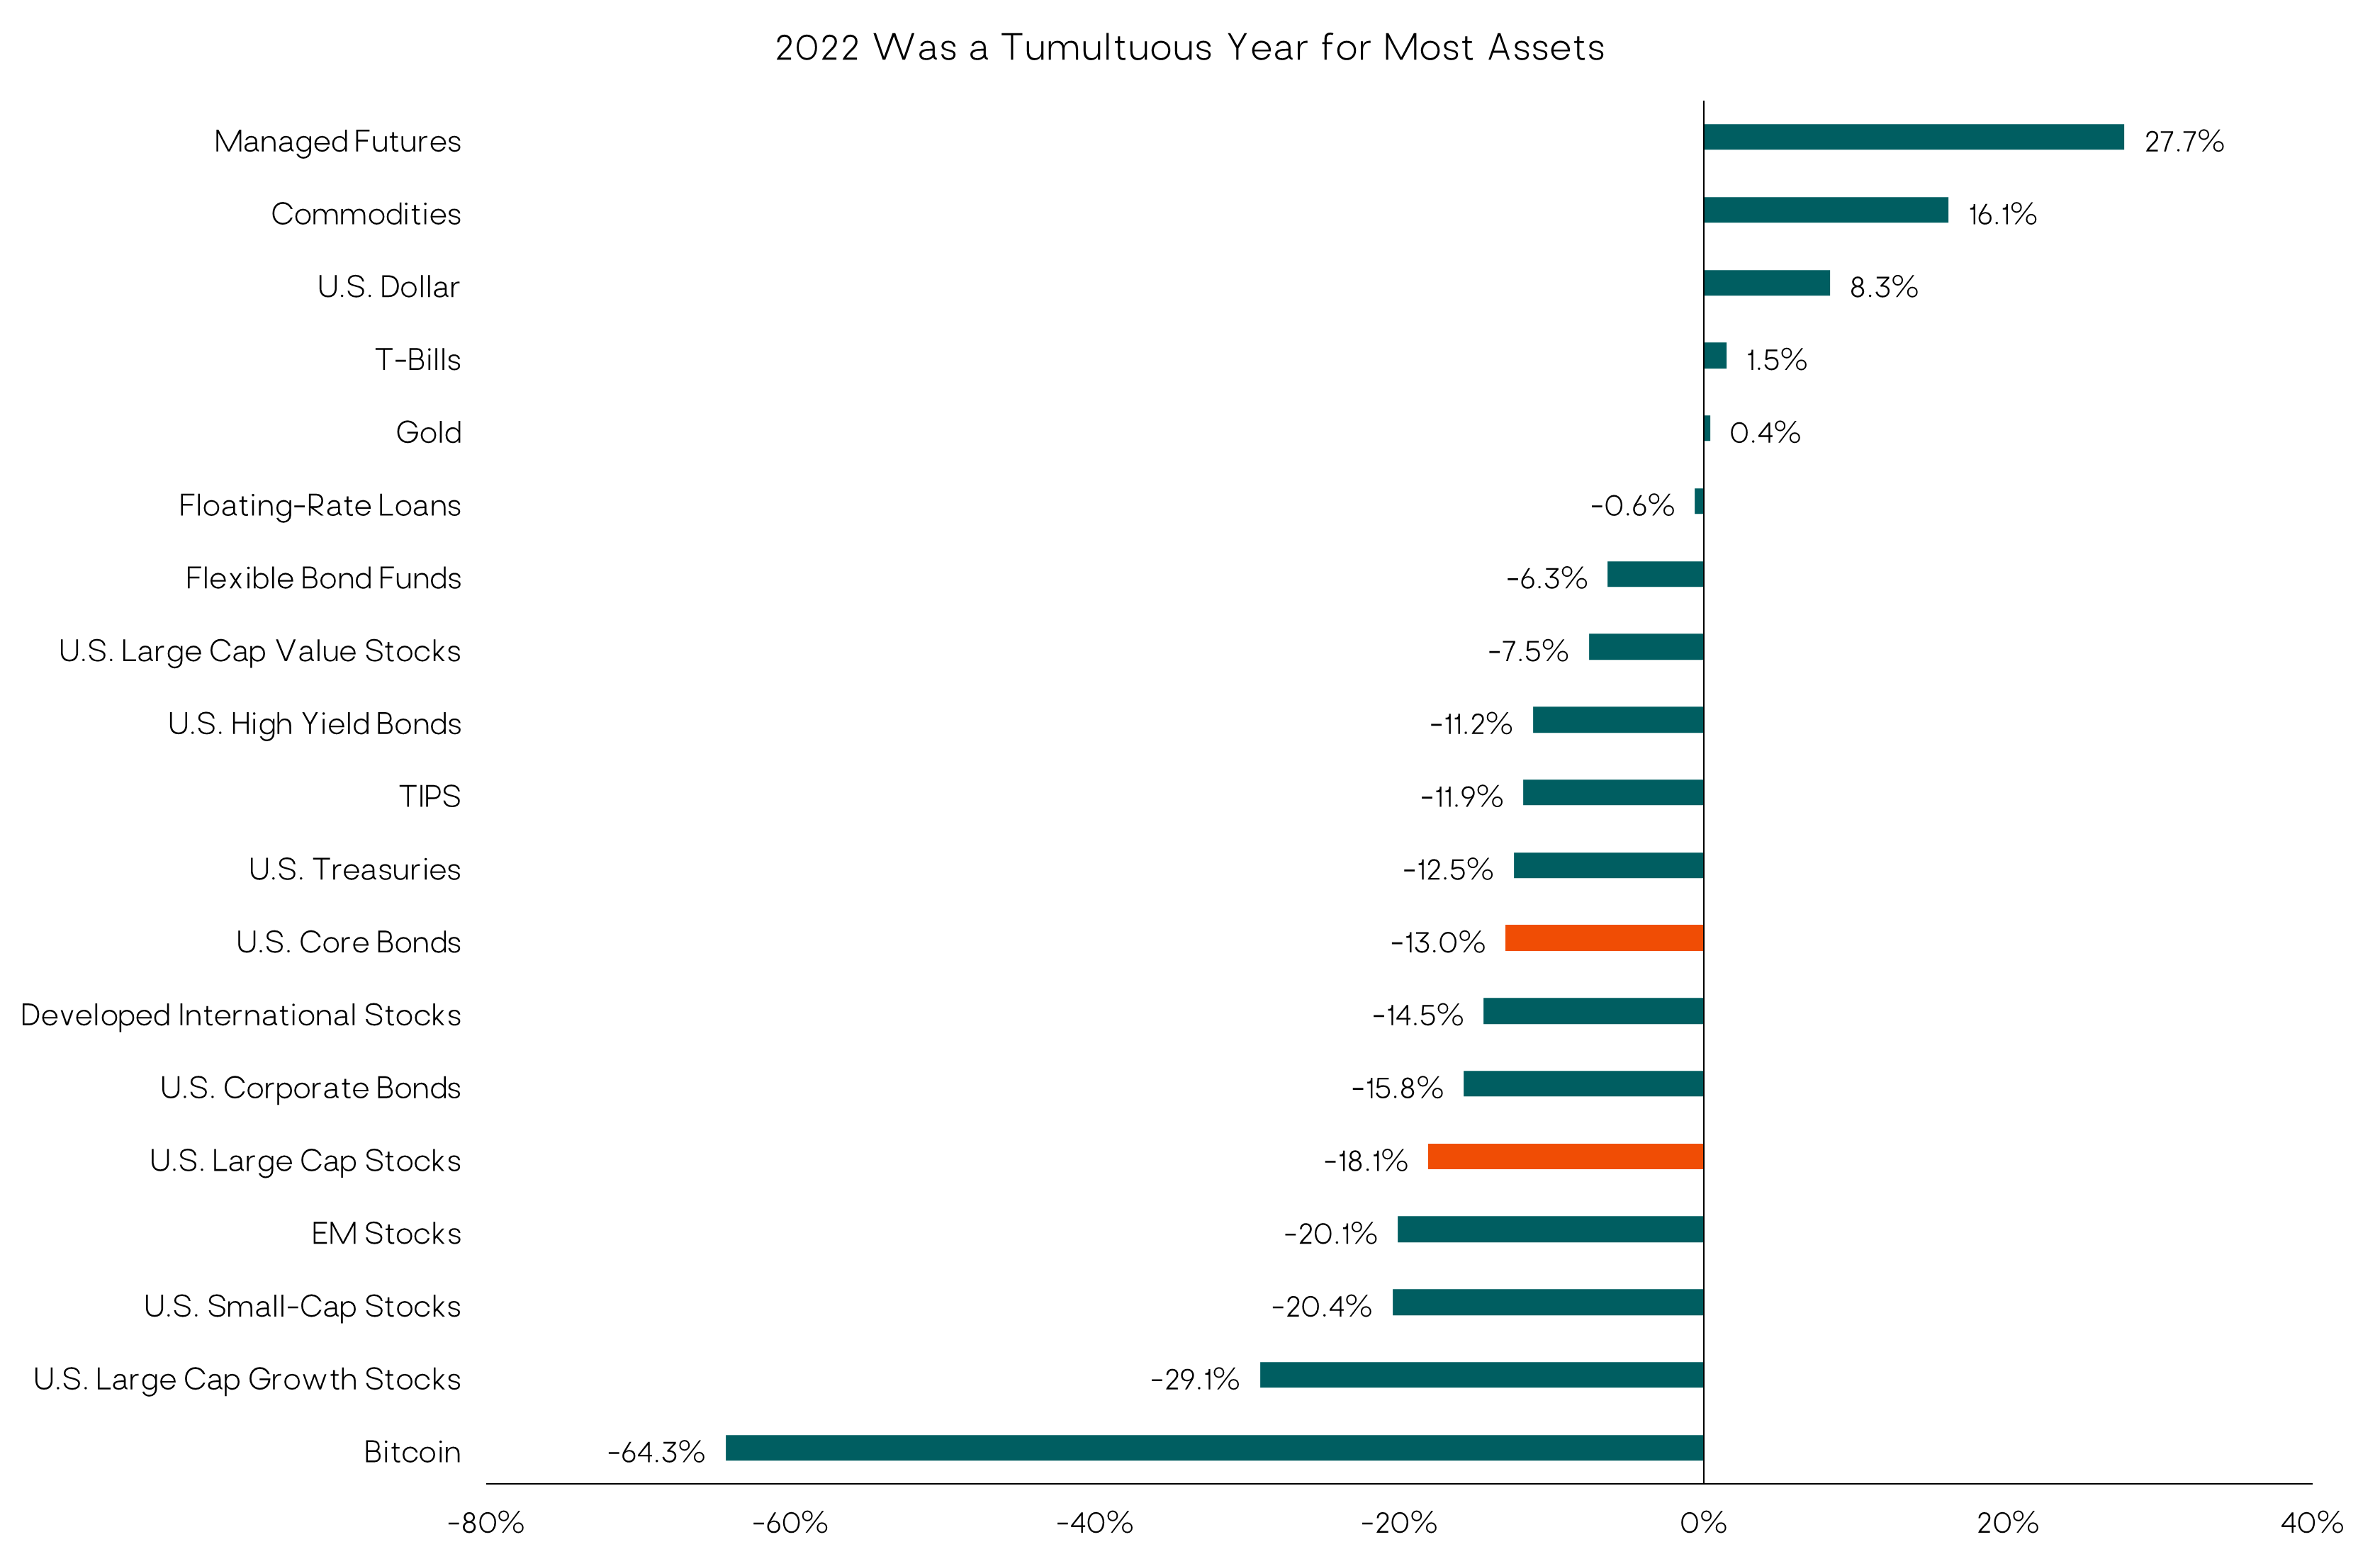
Within a difficult and volatile year in the financial markets, U.S. stocks, as measured by the S&P500 index, began the fourth quarter with a sharp rally in in October and November, gaining back 14%, but then dropped 5.8% in December to close out the year with an 18.1% loss. The annual decline for 2022 was the largest for the S&P 500 since 2008.
Foreign stock markets had a very strong fourth quarter, with developed international stocks (MSCI EAFE Index) gaining 17.3% — one of their best quarters ever — and emerging market stocks (MSCI EM Index) up 9.7%. For the full year, developed international stocks, though faring better than U.S. stocks, were down 14.5% (in dollar terms), while EM stocks were down 20.1% for the year.
A major headwind for non-U.S. stocks was the strength of the U.S. dollar, which appreciated 8.3% for the year (based on the DXY index), reducing dollar-based foreign equity returns one-for-one. However, in the fourth quarter, the dollar dropped 7.7%, providing a boost to EM and international equity returns for U.S. investors to end the year.
Performance reflects index returns as follows (from top to bottom): SG Trend Index, Bloomberg Commodity TR USD, ICE USD Spot, Bloomberg US Treasury Bill 1-3M TR, LBMA Gold Price PM USD, Morningstar LSTA US LL TR, US Fund Nontraditional Bond, Russell 1000 Value, ICE BofA High Yield, Bloomberg US Treasury, Bloomberg US Agg Bond, MSCI EAFE, Bloomberg US Corp Bond, S&P 500, MSCI EM, Russell 2000, Russell 1000 Growth, Bitcoin. Source: Morningstar Direct and Yahoo! Finance. Data as of 11/30/22. Please see Important Disclosure for definitions of the referenced indices.
Turning to the fixed income markets, core investment-grade bonds (Bloomberg U.S. Aggregate Bond Index, aka the “Agg”) had a solid fourth quarter, gaining 1.9%. But 2022 was still the worst year for core bonds in at least 95 years, with the Agg dropping 13.0%. The key driver, of course, was the sharp rise in bond yields; the 10-year Treasury yield ended the year at 3.9%, up from just 1.5% a year prior. High-yield bonds (ICE BofA Merrill Lynch U.S. High Yield Index) had a strong fourth quarter, up 4.0%, but were down 11.2% for the full year.
Alternative strategies and nontraditional asset classes generally outperformed traditional stock and bond indexes. The standout within the alternatives category was trend-following managed futures strategies, which gained roughly 28% (SG Trend Index) for the year, despite fourth-quarter losses. Flexible/nontraditional bond funds (Morningstar Nontraditional Bond category) were down roughly half as much as core bonds.
As shown in the chart below, 2022 was only the third year since 1926 that both U.S. stocks and core bonds declined, and the only year that both asset classes lost more than 10%. 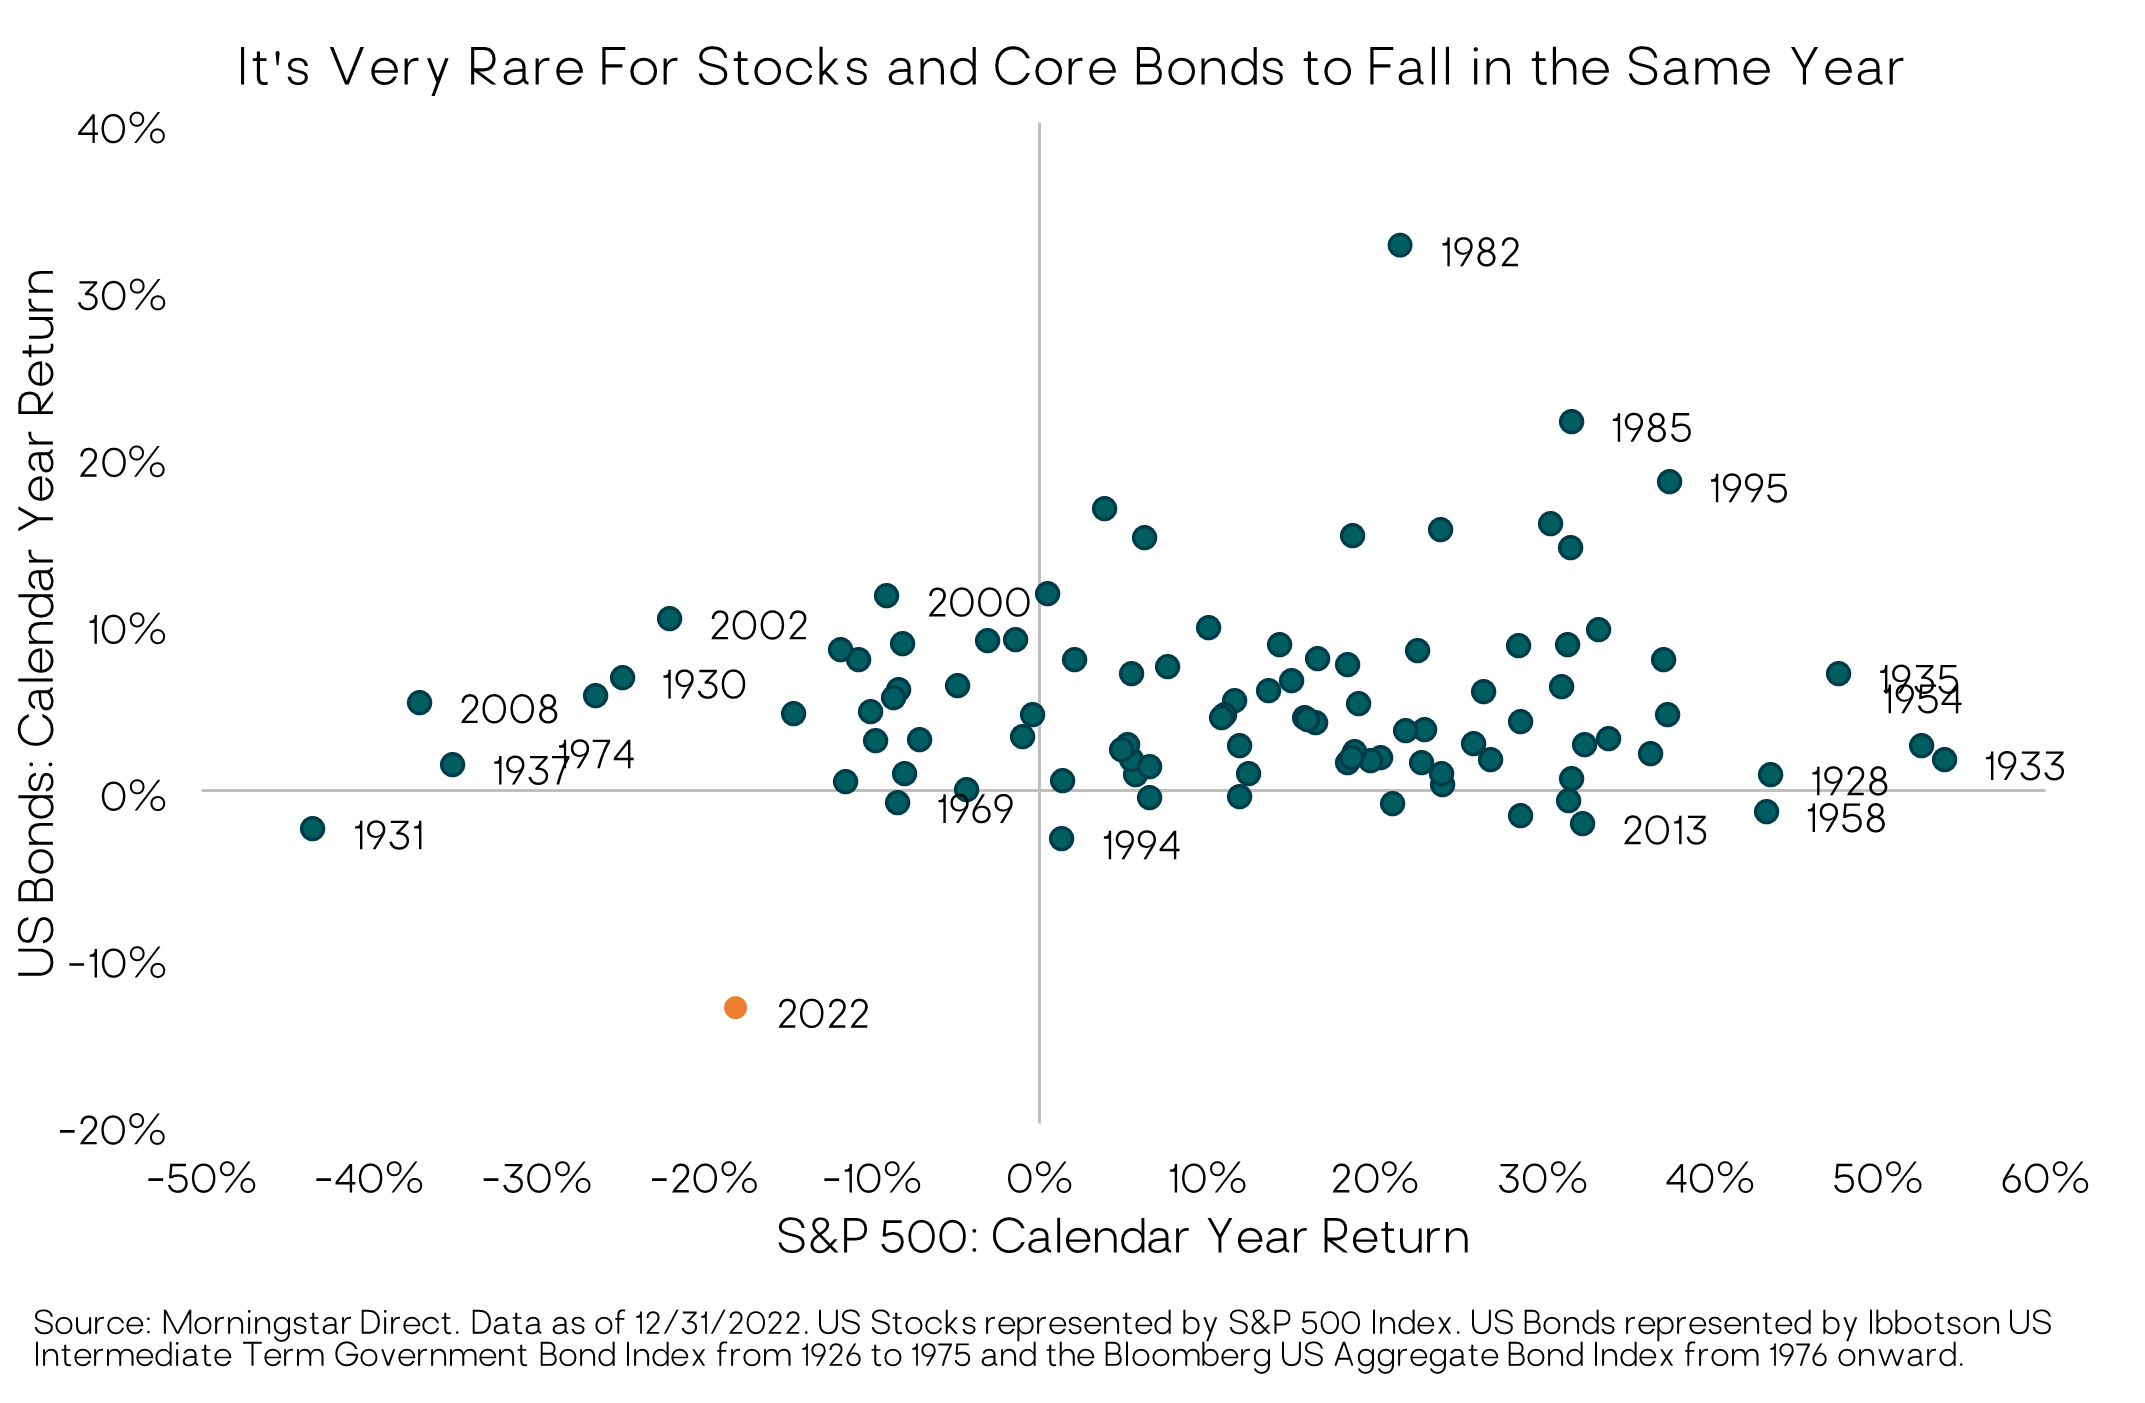
Macro Outlook for 2023: High Likelihood of U.S. and Global Recession, Small Chance of a Fed Soft Landing
We frame the macroeconomic backdrop and outlook across two dimensions: inflation and growth.
U.S. inflation data have improved, suggesting we’ve seen the peak in inflation for this cycle, absent an exogenous shock. But core inflation remains far above the Federal Reserve’s 2% target, and the Fed’s message is that it intends to maintain restrictive (tight) monetary policy throughout 2023.
On the economic growth front, key leading indicators deteriorated further in the fourth quarter, which along with tight monetary policy, point to a likely recession in the year ahead. There are good reasons to think the recession will be a relatively mild one. We also don’t rule out a scenario where the economy slows but doesn’t contract next year — the fabled “soft landing.”
For investors (not economists), the difference between a flat economy and a mild recession next year is a distinction without much difference. What we care about is the impact on corporate earnings and valuation multiples — the latter being a function of earnings, interest rates, and market sentiment (investor herd psychology).
In the sections below, we provide a more detailed update on the macroeconomic landscape, followed by our assessment and outlook for the financial markets (stocks, bonds, currencies)
Inflation
Inflation and Federal Reserve monetary policy remain the financial markets’ key macro focus. In the fourth quarter, major central banks across the globe — except for China and Japan — continued raising short-term interest rates. Tighter monetary policy curtails “aggregate demand” — consumer and business spending — which in turn reduces inflationary price pressures (again, absent exogenous shocks to the supply side of the economy, like wars or pandemics).
The good news is that the October and November U.S. inflation reports showed a sharp fall in headline consumer price inflation (including food and energy prices). Various measures of core inflation (excluding food and energy) have flattened on a year-over-year basis, but at around 5% to 6% are still far above the Fed’s 2% target. 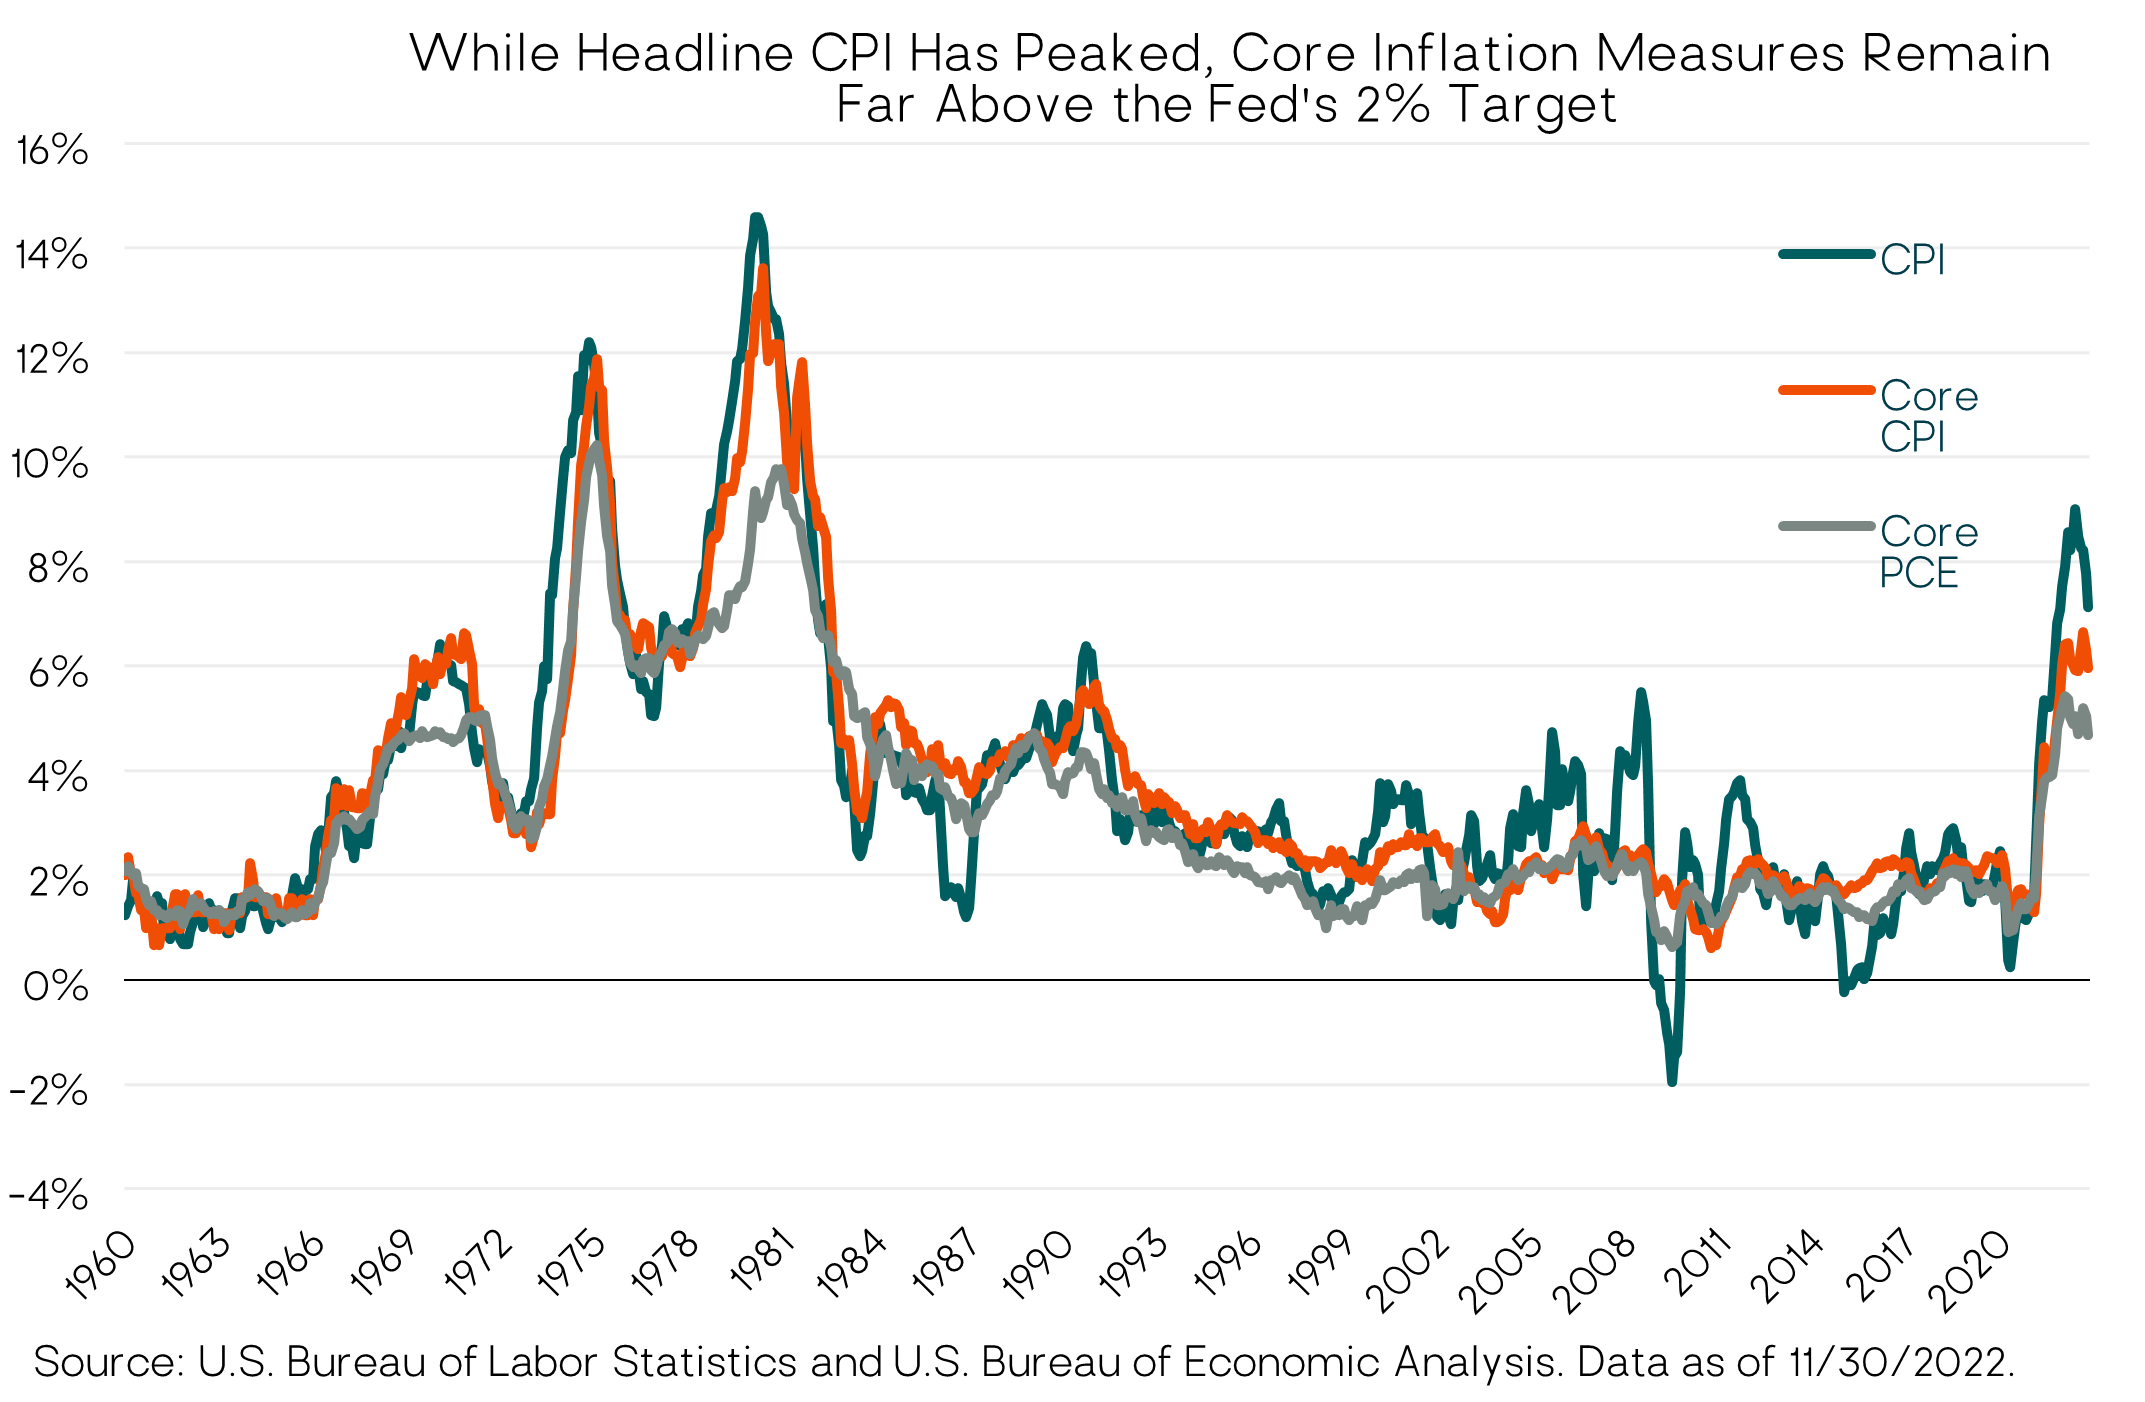
On a more granular level, we see that core consumer goods inflation, which drove much of the high inflation over the past year, has dropped sharply — albeit from extremely high levels to still-too-high levels. But the trend is clearly down as the transitory, COVID-related, supply-chain dislocations continue to normalize, and consumers’ spending preferences (the demand-side) also normalize from goods back towards services.
The less-good news is that consumer services prices are generally stickier (that’s an official economic term) than goods prices. And as the chart below shows, core services inflation is still rising. Fed Chair Jerome Powell has recently cited this as a particular focus of the Fed. 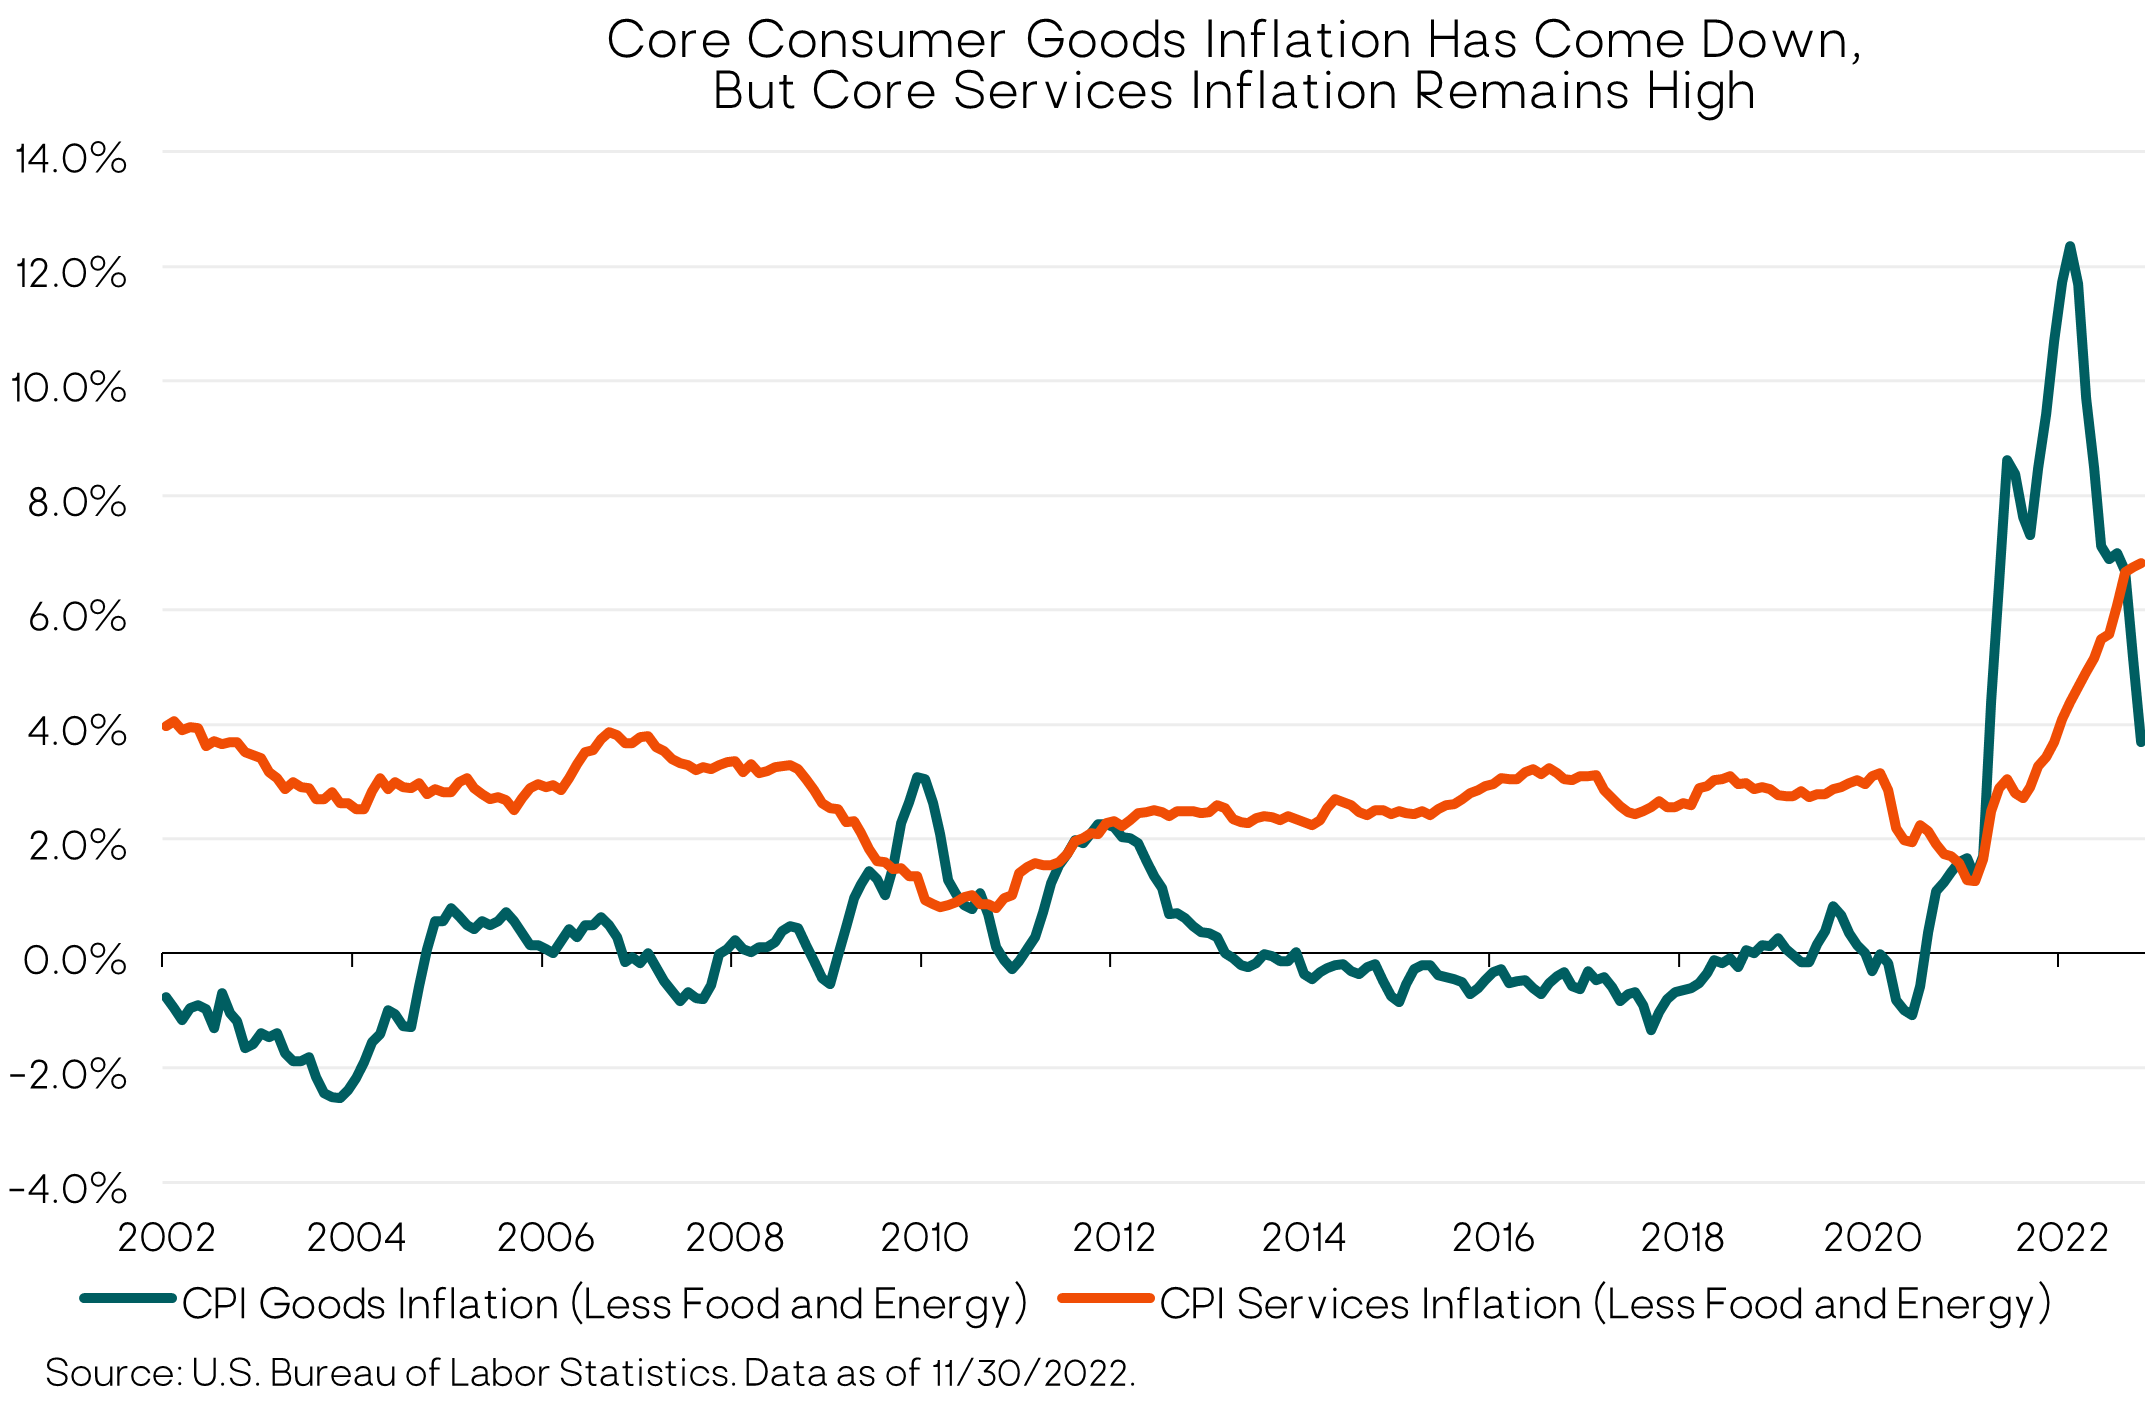
Speaking of the Fed, as expected, at its December 14 meeting, the Federal Open Market Committee (FOMC) raised the fed funds rate by 50 bps to a target range of 4.25% to 4.50%. It also forecasted 75 bps of additional rate hikes in 2023. This is more than the markets expect.
Trying to reset market expectations, Powell struck a “hawkish” tone in his press conference, stressing that the Fed does not expect to cut rates in 2023. The fed funds futures market is currently pricing in Fed rate cuts later in the year.
While we know that the ability for anyone to predict what the Fed will do next year — including the Fed itself — is nothing more than a guess, we think the following quotes from Jerome Powell are worth highlighting as they at least reflect his/the Fed’s current outlook:
- “The inflation data received so far in October and November show a welcome reduction in the monthly pace of price increases. But it will take substantially more evidence to have confidence that inflation is on a sustained downward path.”
- “I would say it’s our judgment today that we’re not in a sufficiently restrictive policy stance yet, which is why we say that we would expect that ongoing hikes will be appropriate.”
- “The historical record cautions strongly against prematurely loosening policy. We will stay the course until the job is done.”
- “The labor market remains extremely tight.”
Each quarter the FOMC publishes its forecasts for inflation, GDP growth, unemployment and the fed funds rate. Continuing the negative trend for the year, the December revisions were for lower GDP growth, and higher unemployment, core inflation and interest rates in 2023. While we’d never expect the Fed to actually forecast a recession – because to do so would all but ensure one ensued – their latest forecast of 0.5% GDP growth in 2023 is about as close as it gets.
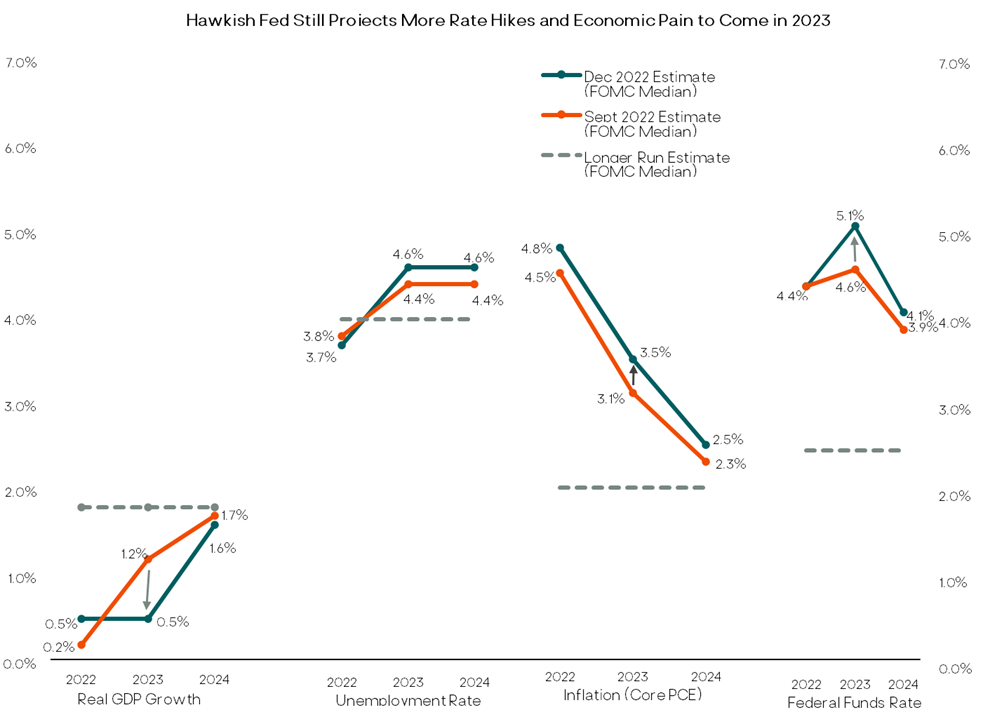
Source: Federal Open Market Committee (FOMC). Data as of 11/30/22.
In addition to higher rates and lower growth, the FOMC also increased its unemployment rate forecast, to 4.6% in 2023. If that plays out, history suggests a recession is likely. Since 1950, there has never been an instance where the U.S. unemployment rate increased by a half percentage point or more from its cycle low without an accompanying recession. The unemployment rate bottomed at 3.5% in July.
Wages
The largest input cost for most businesses, and services businesses in particular, is wages. Wages in turn are partly a function of inflation expectations, which can feed into a self-reinforcing wage-price spiral — the Fed’s biggest fear. 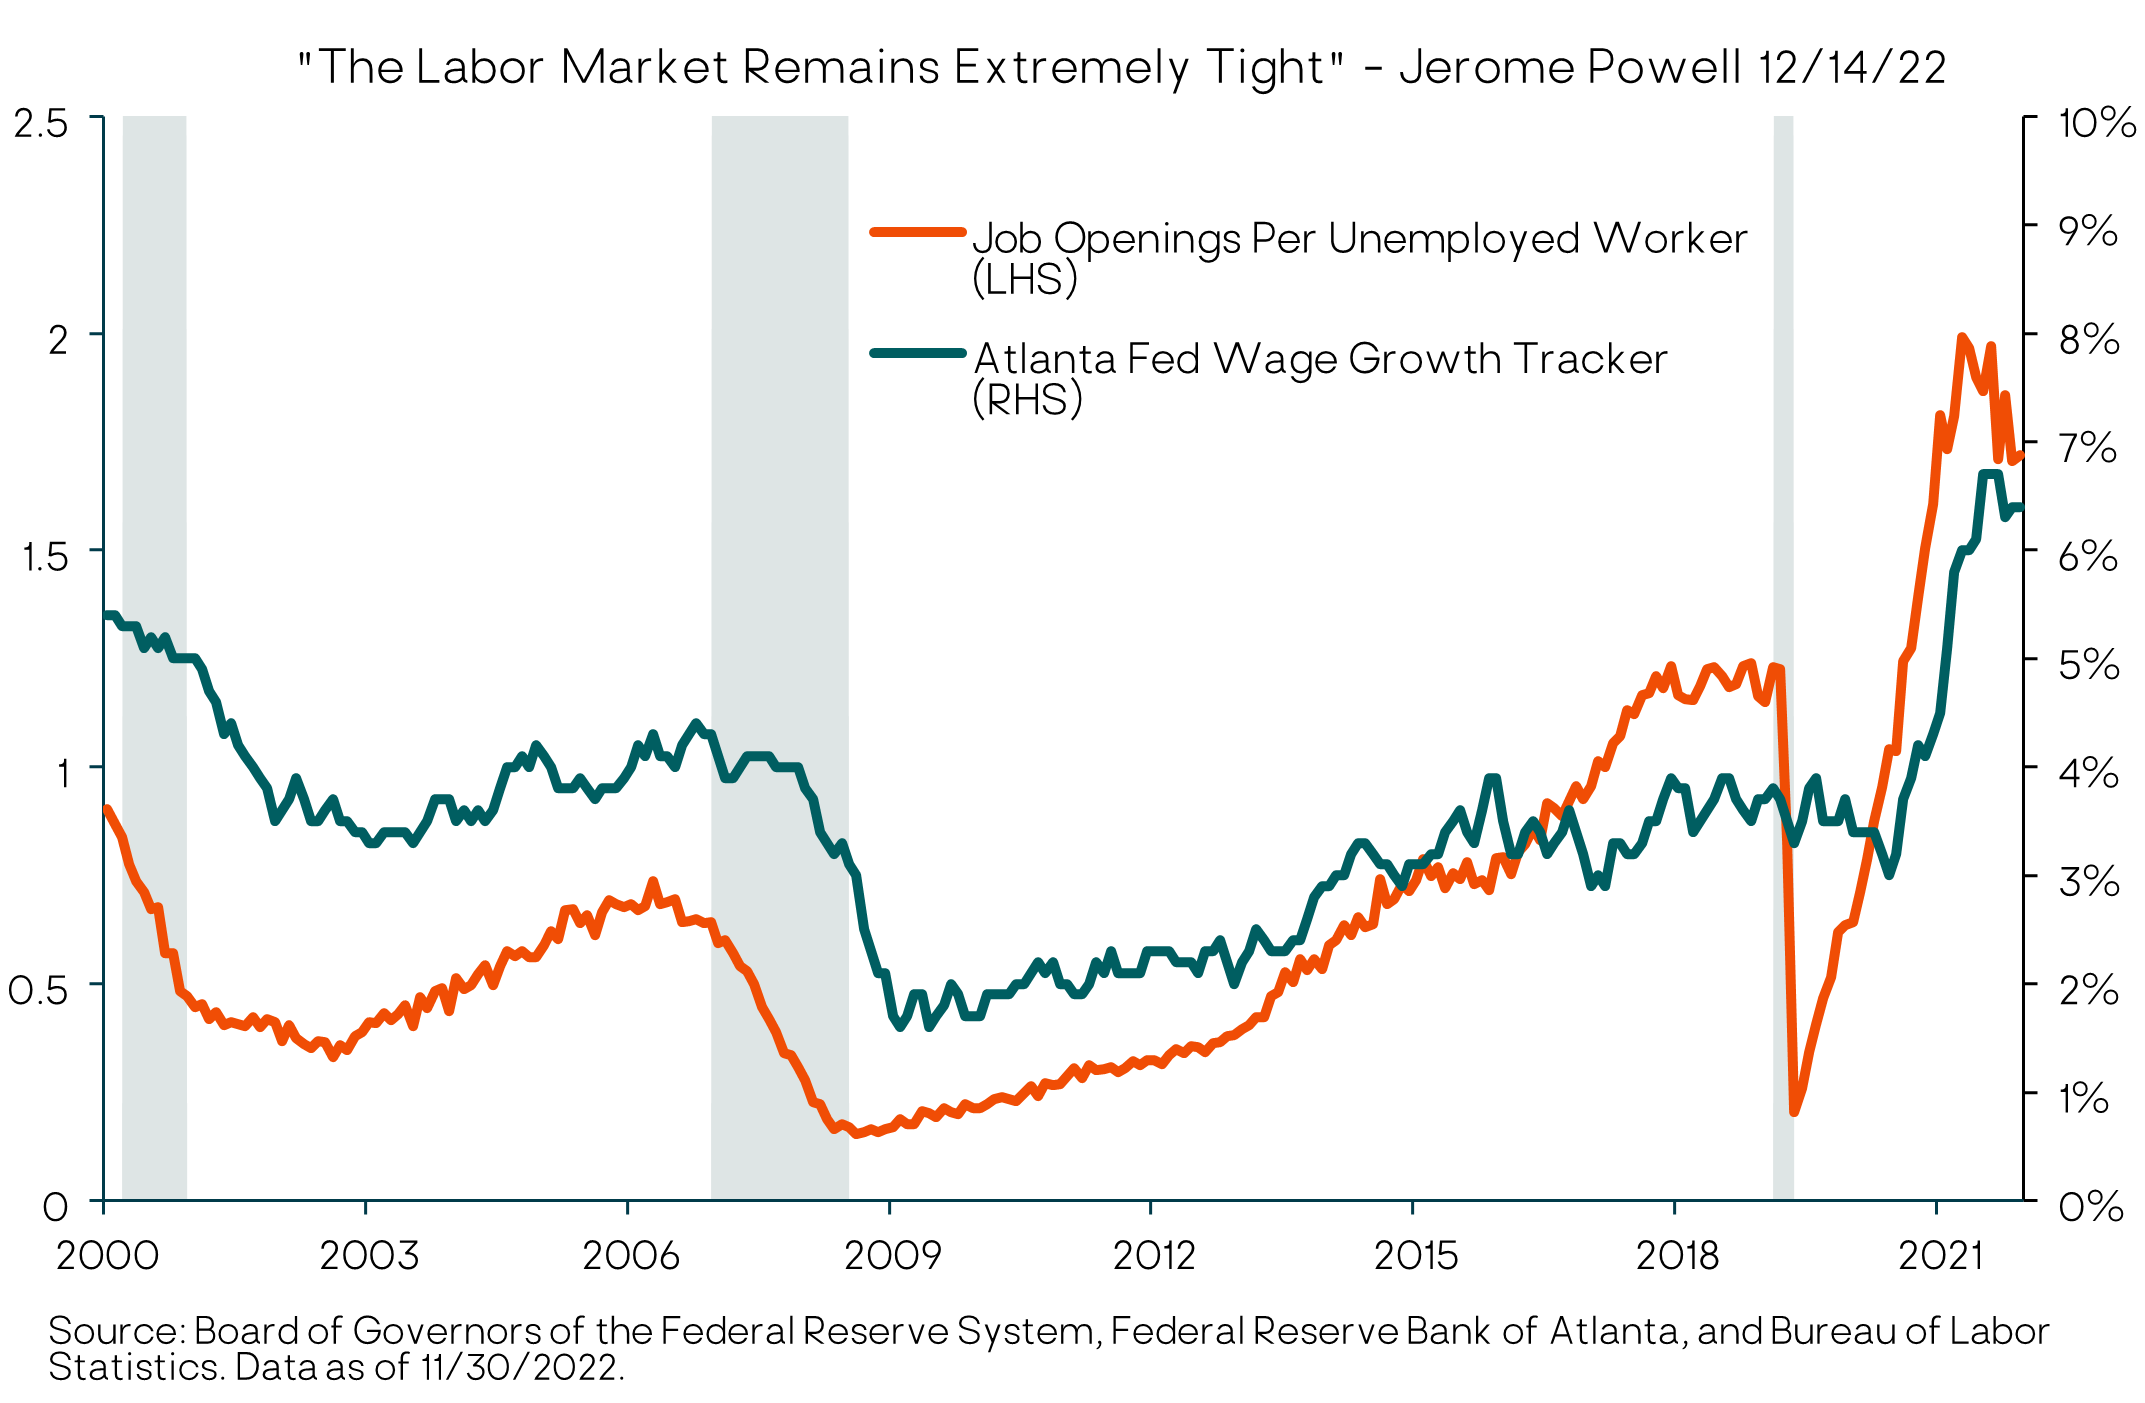
The data on wage inflation and inflation expectations continue to be mixed. As of late December 2022, year-over-year wage inflation at around 6% is inconsistent with the Fed’s 2% inflation target. Wage inflation would probably need to fall into the 3% to 4% annual range for the Fed to be comfortable (assuming labor productivity growth of 1% to 2%). Historically, declines in U.S. wage inflation of that magnitude have only happened during recessions, accompanied by the aforementioned increases in unemployment.
Wages are a function of the supply and demand for labor. As Jerome Powell said, the U.S labor market remains very tight. The 3.7% unemployment rate in November is still near all-time lows. The ratio of Job Openings to Unemployed workers – one measure of labor supply vs. demand – is still near all-time highs, at 1.7 job openings per unemployed worker. As shown in the chart below, there is a strong positive relationship between this ratio and wage growth (wage inflation). As with other inflation metrics, we may have seen the peak in wage inflation but still have a long way to go to get to the Fed’s targets.
More broadly, rising wages correspond to higher overall unit labor costs (defined as compensation per unit of output). And rising unit labor costs are highly correlated with rising core inflation, as the following chart shows. 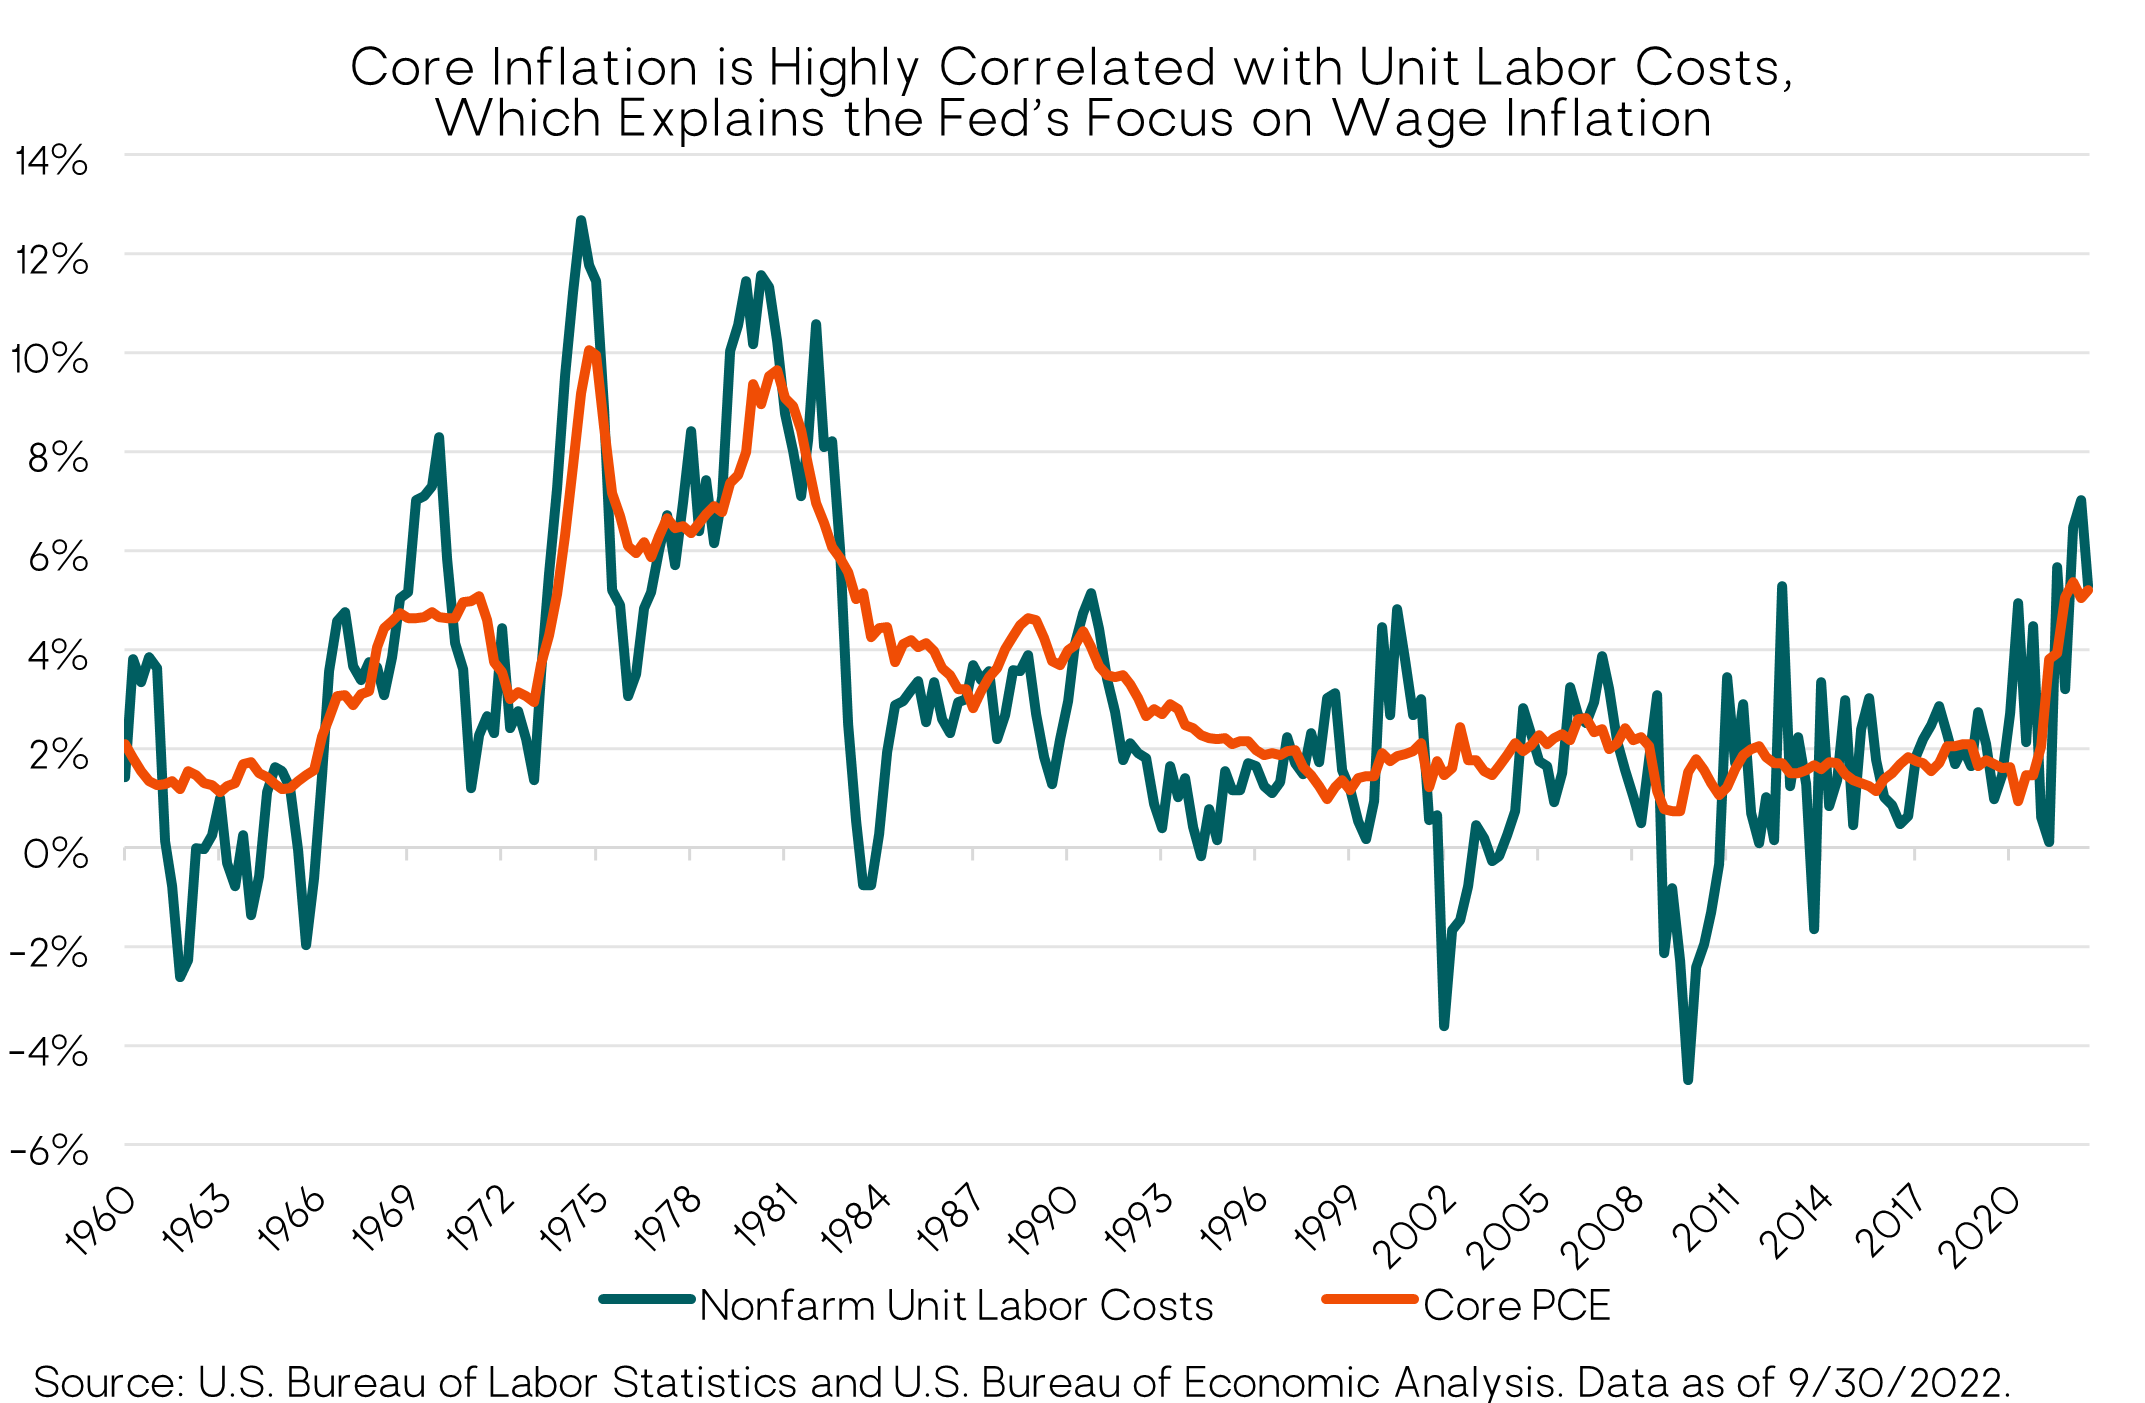
The latest monthly wage data suggest a deceleration of wage inflation. But the Fed will want to see a material and sustained downward trend before declaring victory. The Fed’s hope is that tighter monetary policy will reduce the number of job openings (demand), relieving the pressure on wages without causing a big increase in layoffs and unemployment. That’s a possibility given the unprecedented number of job openings relative to unemployment, but it’s not our base case.
Inflation Expectations
A significant bright spot in the otherwise awful inflation picture this year has been the stability of medium- and longer-term inflation expectations. (Shorter-term inflation expectations, which are highly sensitive to gasoline prices, have also recently been dropping.)
Inflation expectations are crucial, because if they become unmoored they can feed into a self-reinforcing, inflationary wage-price spiral – where wage and price hikes feed back into higher inflationary expectations which feed into further wage and price hikes, etc. This was the inflationary regime that Fed Chair Paul Volcker had to break in the early 1980s. One stark difference (among many) between now and then is that medium-to-longer term inflation expectations reached double-digits in Volcker’s time, requiring a near 20% fed funds rate to ultimately crush the inflationary mindset. In contrast, as shown in the chart below, 5-to-10-year inflation expectations this year have remained in a 2-3% range. 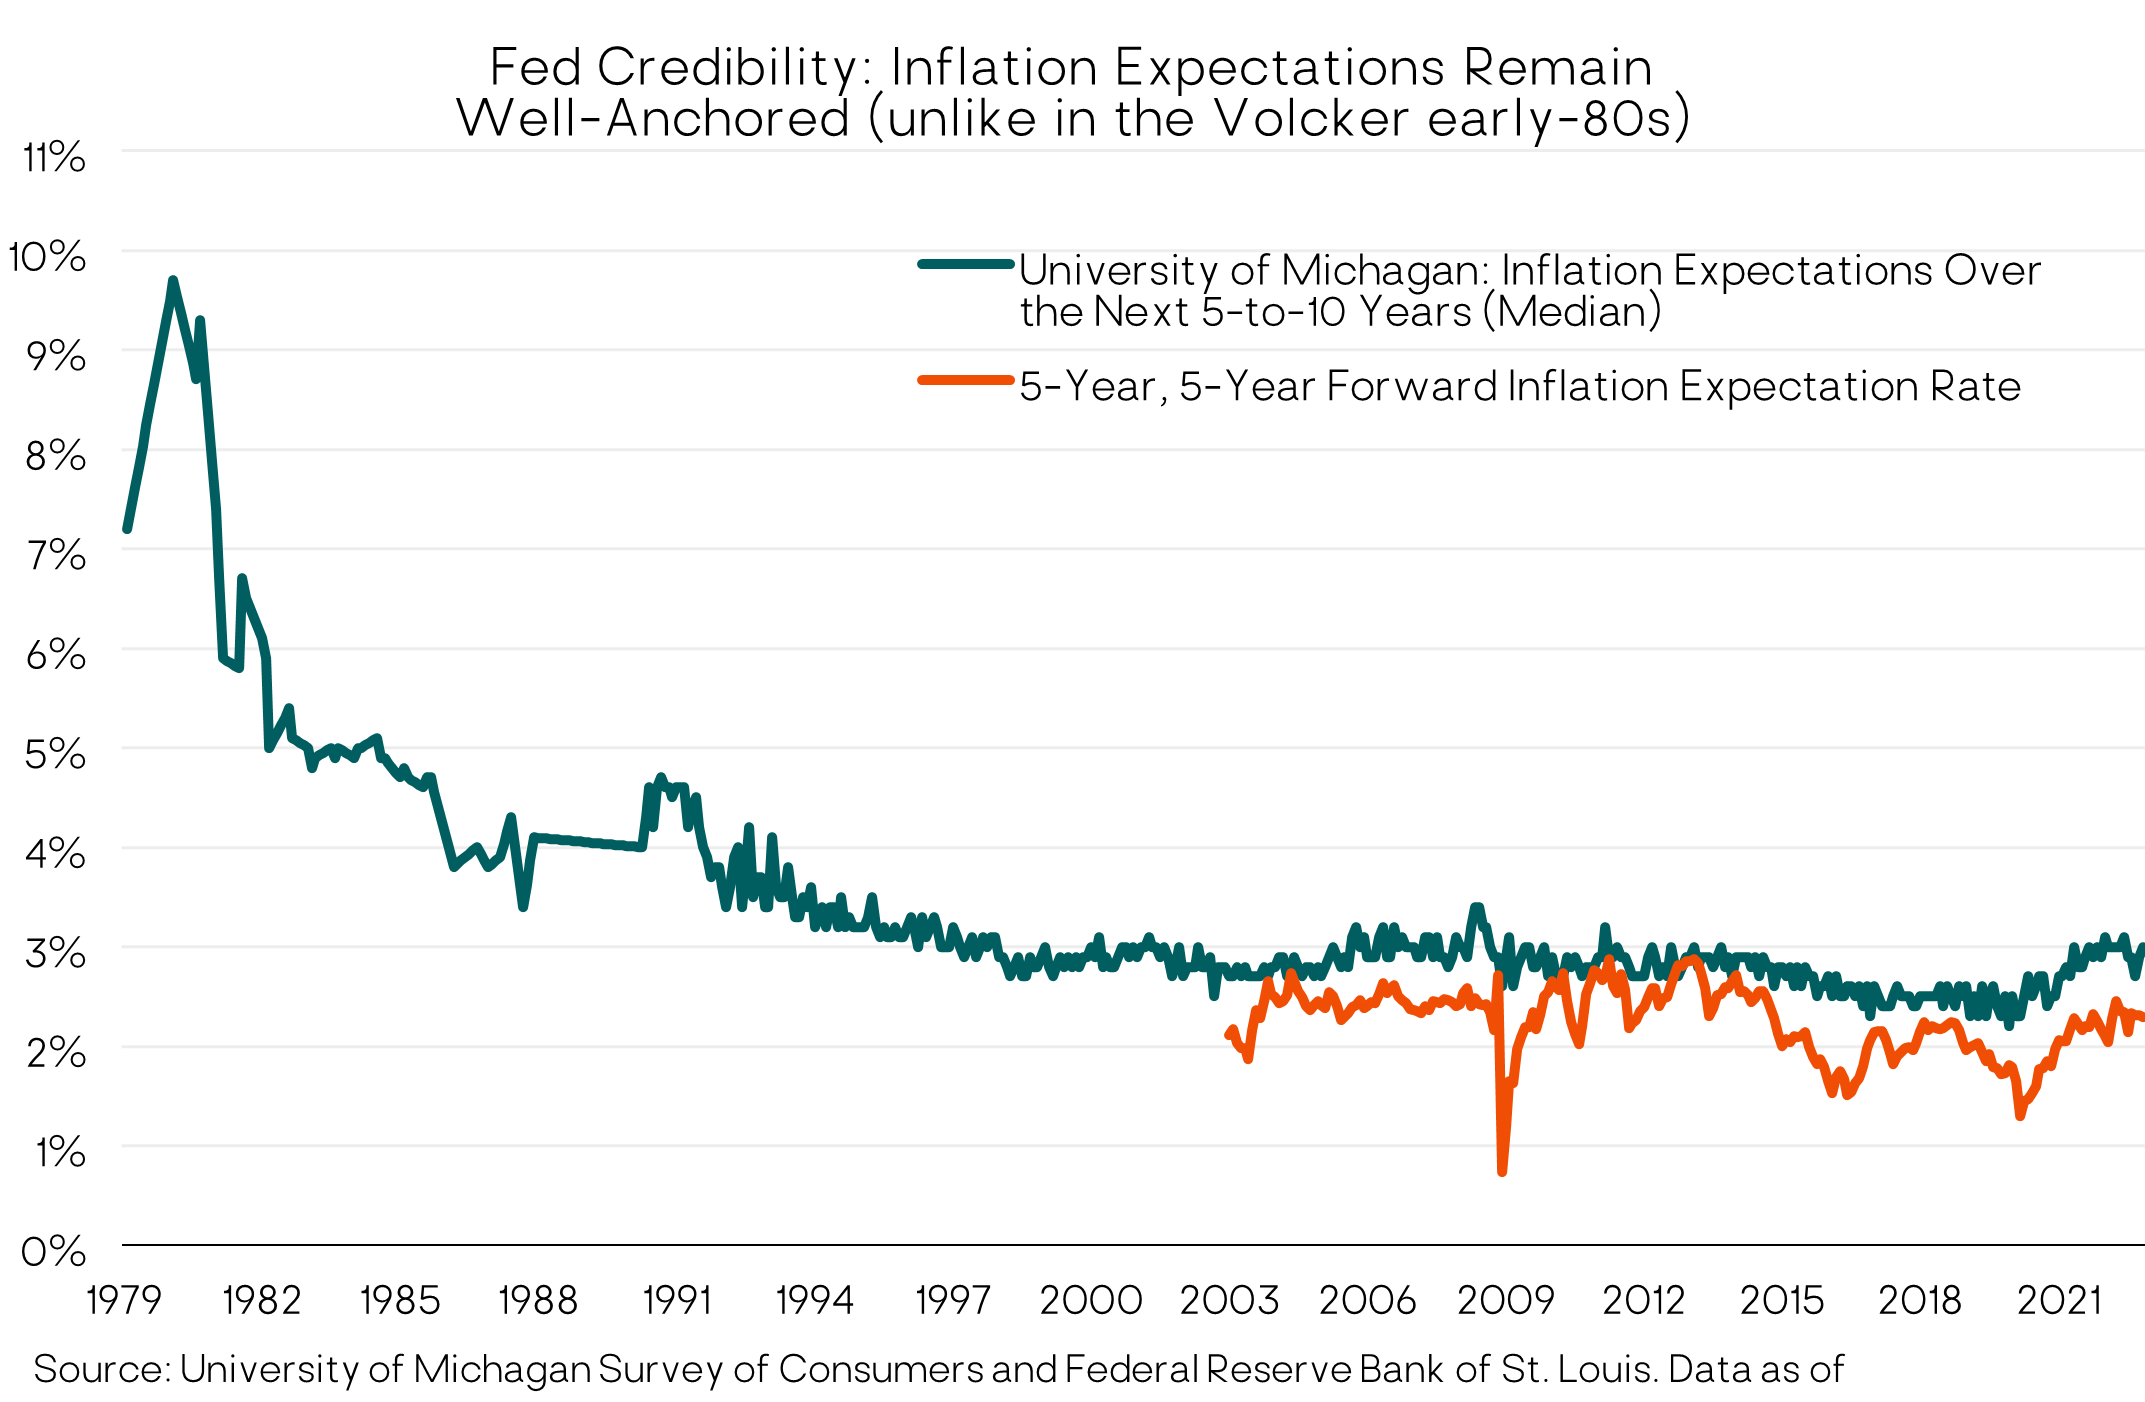
Inflation is not just a U.S. problem. Nearly all the other major global central banks (except Japan and China) are also continuing to hike interest rates to fight inflation in their countries. For example, both the European Central Bank (ECB) and the Bank of England hiked their policy rates another 50 basis points (0.5%) in December. The ECB hawkishly stated, “We decided to raise interest rates today, and expect to raise them significantly further, because inflation remains far too high and is projected to stay above our target for too long.”
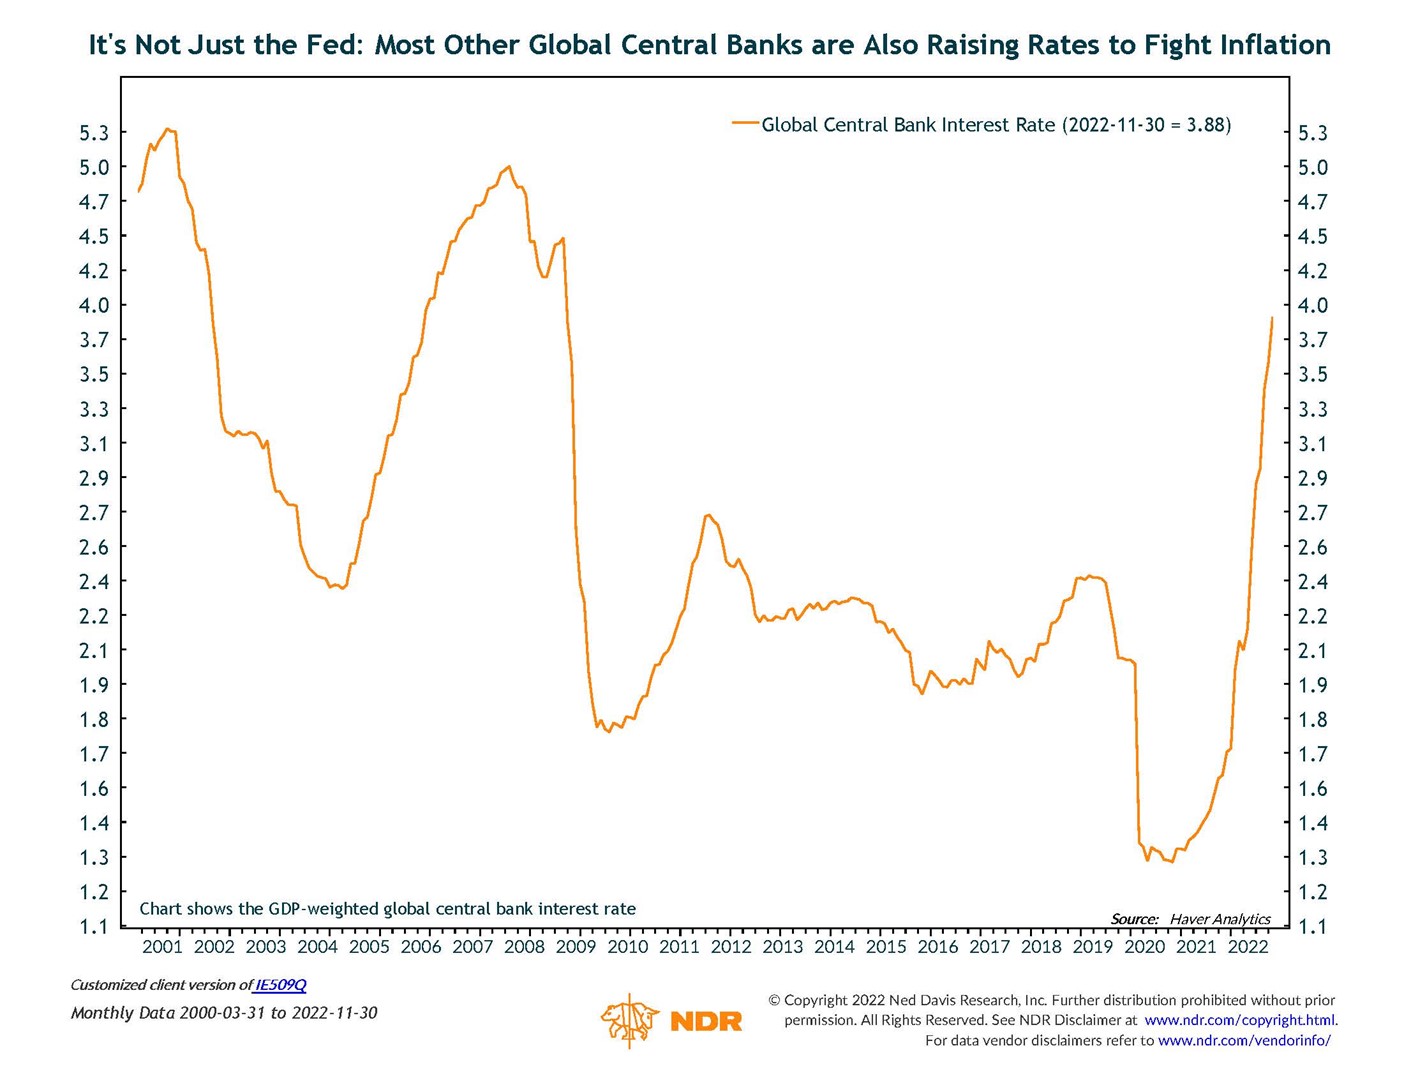
These synchronized global rate hikes will further depress global aggregate demand and economic growth over the shorter term. It’s also typically a headwind for equity markets.
Economic Growth
Along with persistent core inflation, the 2023 growth outlook has worsened for the U.S. and most of the globe. In our recent commentaries we’ve highlighted two widely followed economic indicators that are published monthly: the Purchasing Manager Indexes (PMI) and the Conference Board’s U.S. Leading Economic Index (LEI). Both measures continued to deteriorate in the fourth quarter, signaling a recession is increasingly likely in 2023. 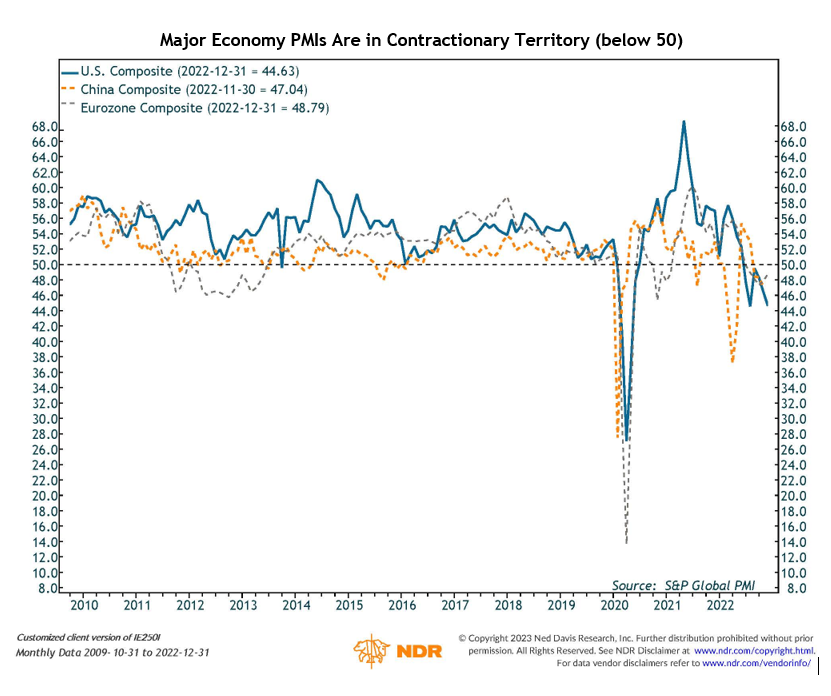
We put particular weight on the LEI, which has a long track record of “calling” recessions. In addition to the magnitude of its recent decline, it has fallen for nine consecutive months (and likely will again in December). This has never happened without an ensuing recession. Having said that, our caveat, as always, is that no economic indicator is 100% foolproof and there is a first time for everything. But in terms of recession probabilities, based on the evidence, we believe the odds are tilted strongly in that direction. 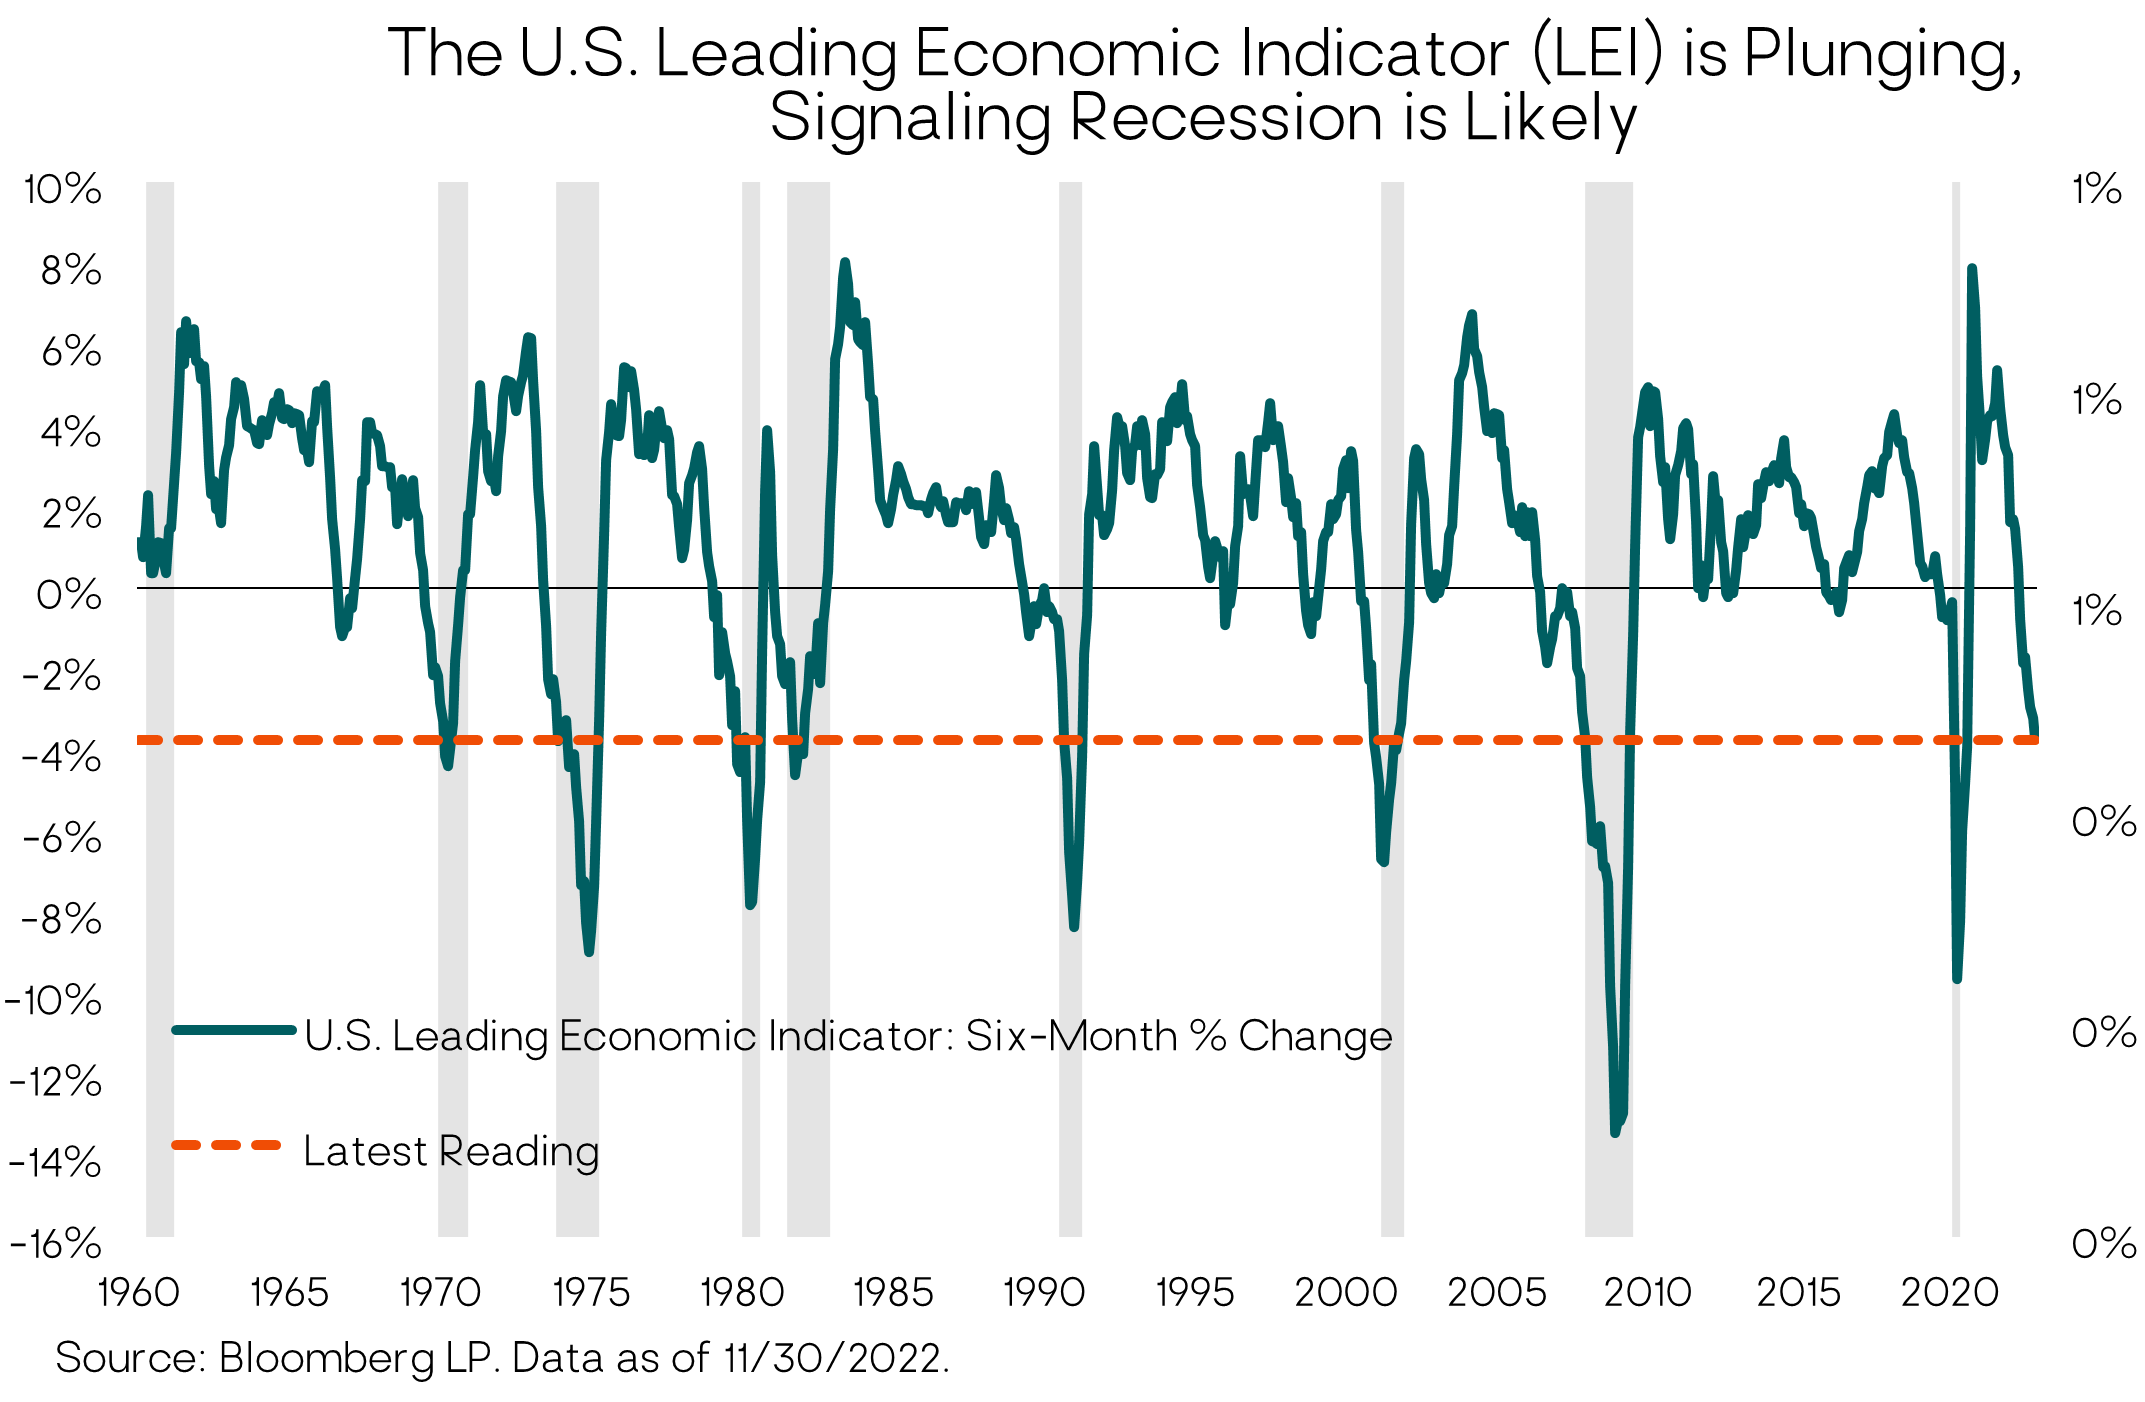
A third time-tested recession indicator is an inverted Treasury yield curve – meaning short-term yields are above longer-term bond yields. An inverted yield curve is unusual and usually (but not always) a leading indicator of recession. The timing from inversion to onset of recession has been highly variable. But as with the LEI, the current degree of inversion has never occurred without a subsequent recession in the U.S., adding to the weight of the evidence. 
Finally, as we’ve noted before, more important than whether the Fed is raising or cutting the fed funds rate is whether the policy rate is at a “restrictive” or “accommodative” level. This year has been the Fed’s most aggressive rate hiking cycle since 1980. At the current fed funds target rate of 4.25%-4.50% compared to inflation expectations of around 2.5% and the Fed inflation target of 2%, one can argue the rate is now in restrictive territory, with the full negative impact on the real economy still to come in 2023 due to monetary policy’s well-known lagged effects.
A counter argument is that with current inflation readings still well above 4.5%, the after-inflation (real) fed funds rate is still negative and therefore not yet restrictive. After the December rate hike, Fed Chair Powell said, “We’re not in a sufficiently restrictive policy stance yet.” If that’s the Fed’s view, it reinforces the likelihood they will continue to raise rates in 2023, albeit at a much-reduced pace than in 2022.
Putting all the macro pieces together, our view from three months ago remains. We see a U.S. and global recession as the most likely scenario over the next 12 months.
But There are Some Economic Positives
While we weigh the evidence as leaning strongly towards recession, there are some positives supporting the economy and that should mitigate the severity of a U.S. recession when it happens. First and foremost, the labor market remains strong, enabling consumer income and spending growth; monthly job growth (nonfarm payrolls) has also remained solid, increasing by 263,000 in November; weekly new unemployment claims (a leading indicator for the labor market) remain low, though they are ticking higher.
Households also still have huge “excess savings” stemming from the pandemic – about $1.5 trillion (down from $2.3 trillion) that can support additional spending even as the Fed tightens. Business balance sheets are also generally in good shape, with many firms having refinanced their debt at low rates prior to this year’s sharp rise. More broadly, there don’t appear to be any major, systemic, economic/financial icebergs lurking under the surface, e.g., unlike in 2007-08 with the housing/mortgage derivatives market.
To the above list of macro positives, we’d add a significant new development in the fourth quarter: the unexpected and sudden abandonment of China’s highly restrictive zero-COVID policy. Zero-COVID has been the key driver of China’s economic slump the past two years. But now the most repressive measures – mandatory testing, quarantines, community lockdowns and travel restrictions – are being revoked.
The reopening of China’s economy for domestic consumers should be a catalyst for a growth rebound in 2023. (Chinese households have built up trillions of dollars in savings since the pandemic.) However, the impact over the next few months will be quite negative as a wave of infections engulfs the country (likely in the hundreds of millions) and uninfected individuals restrict their activity to try to avoid the contagion. China’s COVID vaccination/booster rate, particularly among the elderly, remains far below other Asian nations. According to Capital Economics, in other countries that exited similar zero-COVID approaches it took three to six months for economic activity to pick up.
Most China watchers expect the economic rebound to kick into gear by the second half of 2023, supported by other fiscal, monetary and regulatory policy actions by the Xi regime. China accounts for roughly 20% of global GDP, so the benefits of a Chinese economic recovery are obvious, especially for its key trading partners in Europe, Latin America and Asia.
Bottom Line
A U.S. recession in 2023 is not a certainty. But based on the evidence, we think it is highly likely. On the positive side, it should be milder than the 2007-08 and 2000-01 recessions.
A Fed-engineered soft landing is a possibility, but the historical odds for this outcome aren’t good. The Fed typically tightens until “something breaks.” If the economy defies the leading indicators and remains strong with sustained high core inflation and wage growth, the Fed will likely raise rates “even higher for longer” than the markets currently expect. That scenario would not be good for financial asset prices either. As one market strategist recently put it, one way or other “the Fed and the U.S. market are on a collision course.”
Financial Markets Outlook for 2023 and Beyond
Despite their ubiquity, short-term stock market forecasts are a fool’s errand – as seen by how wrong they usually are – and not a sound basis for a successful long-term investment strategy. Instead, Litman Gregory client portfolios are built on the foundation of a long-term strategic asset allocation that aligns with the client’s risk profile, financial objectives, and investment temperament.
We will periodically make tactical shifts to our strategies based on our analysis of expected risk and return over a medium-term (five-to-10 year) horizon. This medium-term time horizon incorporates a typical “market cycle,” where short-term market dislocations and asset mis-pricings should resolve (or revert) towards their underlying economic fundamentals.
We also incorporate “stress tests” or shorter-term (12-month) downside risk assessments for asset classes in our portfolio construction and management. We want to understand the “reasonable worst-case” shorter-term outcomes and weigh the likelihood of them playing out. Our assessments are based on a weight-of-the-evidence and multi-scenario approach that incorporates both historical market analysis and forward-looking judgement. This is very different from forecasting a 12-month market return and then investing based on that forecast.
As such, and given the inherent uncertainty about the future, our portfolios are structured to be balanced, diversified, and resilient across a wide range of scenarios, but also with the flexibility to be opportunistic when markets get out of whack (i.e., when current prices do not reflect underlying longer-term fundamentals) due to excessive fear or greed. In such cases, we act contrary to the current market mood – trying to be “greedy when others are fearful” (Buffett again) and vice versa.
Equity Markets
Our assessment of the U.S. equity market (S&P 500 index) has not materially changed from the end of the third quarter. In sum: We do not believe the S&P 500 is adequately discounting the likelihood and severity of an oncoming earnings recession.
In our third quarter investment commentary we walked through the details of our U.S. equity analysis. The key elements remain in place; if anything, the outlook has deteriorated over the past three months with the economic data worsening but the U.S stock market several percent higher than it was then.
Shorter-term S&P 500 Downside Risk
The average peak-to-trough decline for the S&P 500 in post-WWII “recessionary bear markets” has been 35%. That would imply the S&P 500 falls to 3,100, from its peak of 4,800 in January 2022. The median decline has been 32%, which would be 3,260 on the S&P 500.
We’ve often said, “The economy isn’t the market,” meaning that financial markets often move in unintuitive ways relative to the current economic news. For example, a recessionary economy with a high unemployment rate is usually associated with strong stock market returns going forward (because most investors are fearful). Conversely, when the economy is very strong and earnings growth very high, forward equity returns are usually poor (as overly optimistic investors have priced in unrealistically high growth expectations).
So, the fact that we (and the consensus of economists) expect a recession next year doesn’t necessarily mean equities will do poorly, if the market has already discounted a recessionary outcome in current prices. However, looking at consensus corporate earnings forecasts for 2023 that isn’t the case.
Specifically, our analysis (and that of other strategists we follow) shows that S&P 500 index earnings typically decline around 15% to 20% during economic recessions as both sales growth and profit margins compress. In a mild recession, the earnings decline might be closer to 10%-15%.
Whether earnings fall 10% or 20%, that is a far cry from the current market forecast that S&P 500 earnings will grow by roughly 5-10% in 2023. We take that consensus growth number with a large grain of salt and note that 2023 earnings estimates have been coming down for several months now. But we still view the gap between a 10-20% earnings decline in 2023 and current market expectations as too wide and not adequately discounting the likelihood and magnitude of an earnings recession.
Assuming a 10-20% earnings decline for the S&P 500 across a range of reasonable valuation multiples, we derive the following matrix of potential peak-to-trough S&P 500 index declines for this cycle. 
Within this matrix, we believe the most likely outcome range is -33% to -44%, corresponding to an S&P 500 level of 2,700 to 3,200 at the bear market bottom. This is also consistent with the 3,100 to 3,200 range based on the simple historical average and median recessionary bear market declines cited above.
With the S&P 500 ending the year at 3,840, we could see a 15-25% market drop at some point in 2023, before the market then starts rebounding on expectations of Fed easing and a new economic and earnings growth cycle.
Relative Attractiveness of U.S. Stocks versus Bonds
The above analysis looks at the absolute shorter-term risk/return for U.S. stocks. But equities don’t exist in a vacuum. Multi-asset portfolio managers (such as ourselves) also evaluate the relative attractiveness of asset classes versus each other. At the highest level, this is a comparison of stocks versus bonds, also referred to as the equity risk premium (ERP) — the extra return an investor should expect to earn (or historically has earned) from owning stocks versus low-risk Treasury bonds.
Given the sharp rise in core bond yields this year, stocks no longer look cheap relative to bonds, as shown in the chart below. To revert to a more normal ERP will require a decline in equity valuations, lower bond yields, or some combination of both. 
Five-year Expected Returns for Global Equities
The third piece of our weight-of-the evidence stock market assessment is our estimate of five-year (medium-term, tactical) expected returns. The expected return is essentially the sum of three components: (1) the market’s dividend yield; (2) the annualized percentage change in the P/E valuation multiple between now and five years from now; and (3) the implied earnings-per-share (EPS) growth rate over the next five years, which we derive from our sales growth and profit margin assumptions. (We described our methodology and key assumptions for each major geographic market in our Q3 commentary and asset class reviews.)
The following table shows our five-year expected returns for the U.S., Europe, and EM equity market indices across a range of scenarios, as of 12/31/22. For U.S. stocks our Base Case return estimate ranges from 3.1% to 9.3%, with a central tendency of roughly 6%.
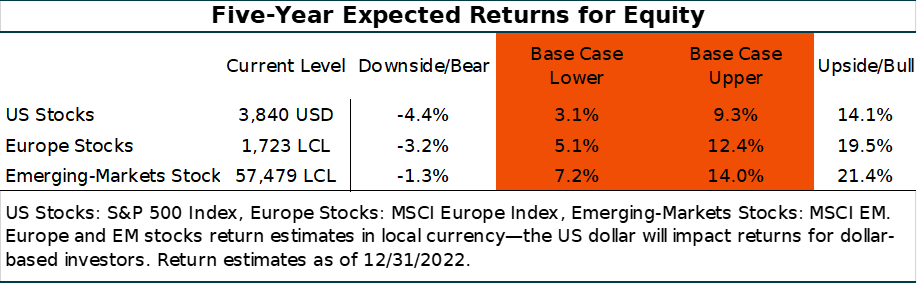
That would be towards the low end of a reasonable expected-return range in an environment with average or normal U.S. equity risk. But it’s too low an expected return given our conviction that an earnings recession is likely in the next year with significant downside for stocks and considering relatively attractive bond returns thanks to their higher yields, plus core bonds’ superior downside protection.
As such, our medium-term analysis is consistent with our shorter-term risk analysis and our relative-return/equity risk premium analysis, which all point to U.S. stocks not (yet) adequately pricing in the risks we see. This was why we reduced our target U.S. equity exposure in favor of core bonds in September, and are not making any changes to those portfolio allocation targets at this time.
A few more reasons why we don’t think U.S. stocks have yet bottomed
Several other historical market facts support our view that we have not yet seen the market low for this cycle, i.e., that the S&P 500 will drop below its October 2022 low of 3,577.
- S. equity bear markets have never ended before the start of a recession. If this holds true again, a recession in 2023 would imply we haven’t yet seen the cyclical market low. Again, anything can happen, but it would be unprecedented.
- The stock market has typically bottomed several months after the last Fed rate hike. Given the Fed just hiked again in December, this also supports the view that the market has further downside ahead.
- Inverted yield curves typically un-invert before the stock market bottoms.S. yield curves remain deeply inverted.
In sum, as we weigh the trade-off between short-term downside risk management (playing defense) and medium-term upside return potential (playing offense) we want to shift our portfolios towards more defense right now, and we do not believe we are giving up return in doing so. When the equity market declines to levels that offer compelling medium-term returns — which typically happens during a recession when investor pessimism and fear are strong — we will look to play more offense.
International and EM Equity Markets
Foreign stock markets and earnings are also at-risk from a U.S. and global recession in 2023 and we trimmed our target exposures there as well this past September. However, unlike the S&P 500, our five-year base case expected return estimates for developed international and EM stocks are reasonably attractive in absolute terms, ranging from the mid-single digits to the low-double digits, with EM the highest. (See the table above.) These returns are even more attractive relative to U.S. stocks and core bonds. 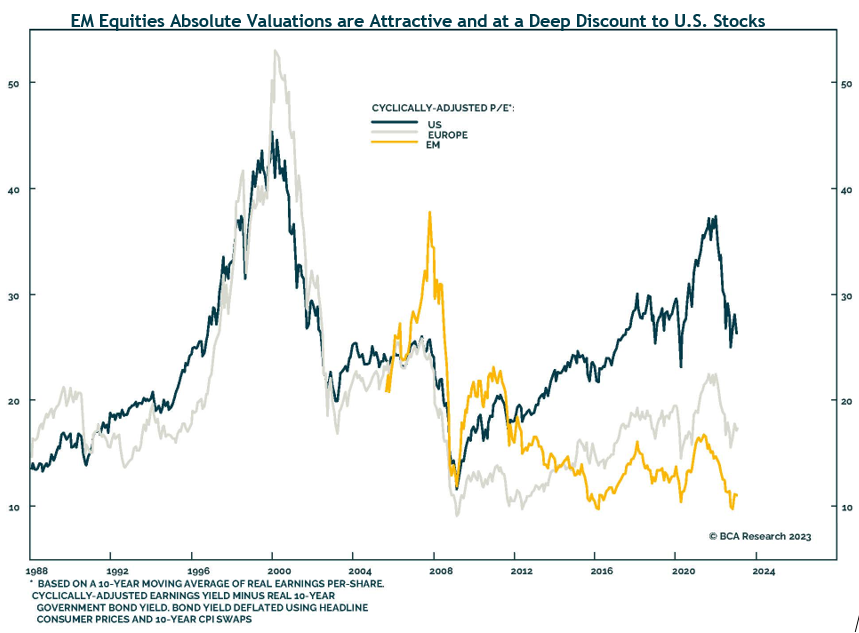
Between the three regions, we tactically favor EM stocks right now based on their higher expected returns, which are a function of what we expect will be faster sales growth and improving profit margins over the next several years. This comes after more than 10 years of stagnant EM earnings growth. Monetary policy is also likely to start loosening next year across many emerging markets as inflation comes down, which should be another support for EM equity markets.
China is a Tactical Opportunity with Longer-Term Risks
China is obviously an important factor in our overall EM outlook, as it comprises roughly one-third of the EM stock index. While we have significant concerns about China’s political economy over a strategic/longer-term horizon, we see reasons for guarded tactical optimism as recent policy shifts and official pronouncements indicate a more pragmatic path since the 20th Party Congress ended in October 2022.
In addition to their abrupt U-turn on zero-COVID policy, Chinese authorities have indicated they will provide additional support for the decimated residential property sector, an important driver of consumer sentiment and GDP growth. The double whammy of zero-COVID lockdowns and property sector crackdowns drove the economy into recession. Reversing or reducing these hurricane-strength headwinds should have significant economic benefits that should start appearing by the spring of 2023.
A relaxation in geopolitical tensions – e.g., the Biden-Xi meeting at the G20 summit in Bali and other outreach and cooperation with the West – are also short-term positives. As such, the very negative sentiment surrounding Chinese stocks seems to be lifting for the time being, as seen by the nearly 30% rally in Chinese stocks (MSCI China Index) in November. Yet, at current valuations an economic reopening and recovery in 2023 is not priced into the market, even accounting for the rest of the global economy slipping into recession and falling demand for Chinese exports.
The U.S. Dollar Could be An Additional Tailwind for Foreign Equity Returns
Our five-year return estimates for developed international and EM stocks do not include any currency effects. As dollar-based investors here in the U.S., our EM and international stock investments will have even higher returns if the dollar depreciates in the coming years, as we expect. (For example, if the dollar depreciates 10% over the next five years, it will add roughly 2% per year to the returns from foreign stocks.)
The U.S. Dollar index was up 8% for 2022, but that includes an 8% decline in the last three months. We would expect the dollar to strengthen again in the short-term as the global economy slows — because the dollar is a counter-cyclical, safe-haven currency that typically appreciates when global growth is declining — and/or if the Fed hikes rates higher for longer. But we believe the medium-term direction for the dollar is lower for several reasons — large U.S. twin deficits, rebounding ex-U.S. growth relative to U.S. growth, shrinking interest rate gap between U.S. and ex-U.S., reversal in bullish dollar sentiment and momentum — as we’ve discussed in previous commentaries.
Should the dollar’s recent negative momentum versus EM currencies continue, that would be very positive for EM stocks. As shown in the chart below from Ned Davis Research, over the past 20 years the MSCI EM stock index has risen at a rate of more than 20% per annum when the relative strength of EM currencies versus the dollar is in an uptrend (defined as above its 50-day moving average). This is consistent with other historical evidence that a declining dollar is a big tailwind for international and EM equity returns for dollar-based investors. 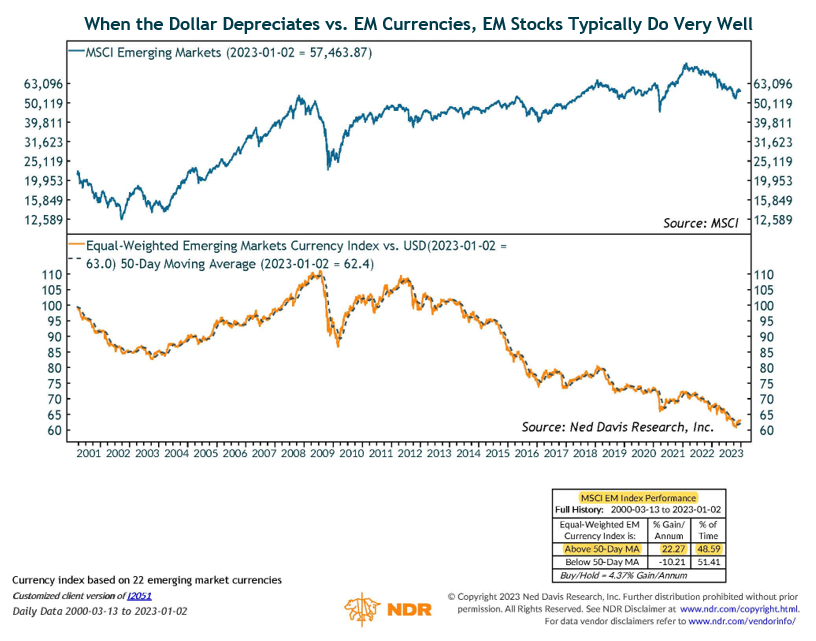
In addition to the points above, the dollar also still looks very overvalued on a fundamental (purchasing power parity) basis. As with equity market valuations, currency valuations don’t matter in the short run, i.e., they are not predictive of near-term currency returns because other factors dominate. But over the longer-run, fundamentals and valuations ultimately win out and are reflected in asset (and currency) prices and returns. 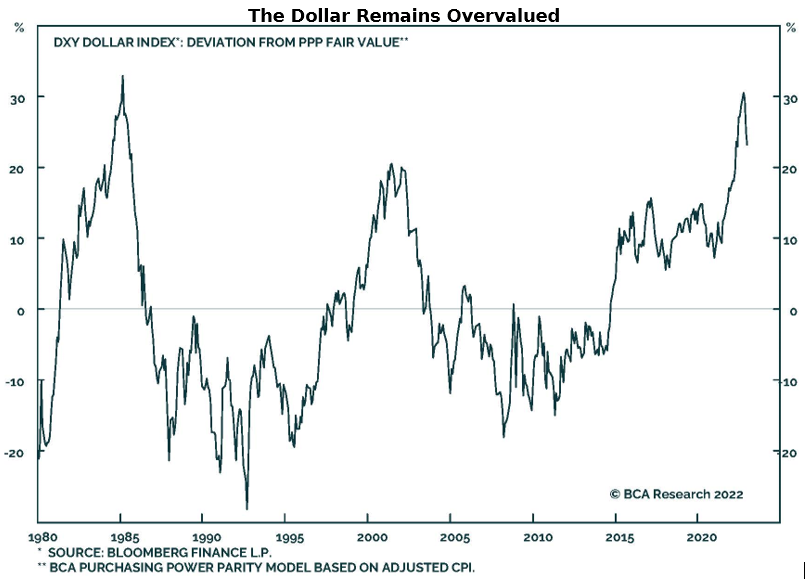
Fixed Income
The past year has been one of the most difficult investment environments ever for the bond markets. The traditionally defensive Bloomberg U.S. Aggregate Index (“the Agg”) lost 13% in 2022 as high inflation led to a spike in interest rates. While losses have been painful, the good news is that current yields will likely translate into positive returns that bond investors have not seen in years.
When evaluating fixed-income asset classes, we start by defining a range of economic scenarios which includes estimating end-of-period Treasury rates, inflation levels, and real rates. The objective of this exercise is to understand the potential range of outcomes and consider those outputs when constructing portfolios. In addition to our five-year return estimates, we also evaluate shorter-term scenarios when considering allocations to fixed-income sectors as the range of potential outcomes for most fixed-income assets is much narrower and the degree of certainty higher than for equities.
Core Bonds
When estimating returns for core bonds (the Agg) over longer periods of time, the starting yield is a good approximation of subsequent returns. The chart below illustrates the strong relationship between starting yields and subsequent 5-year returns. 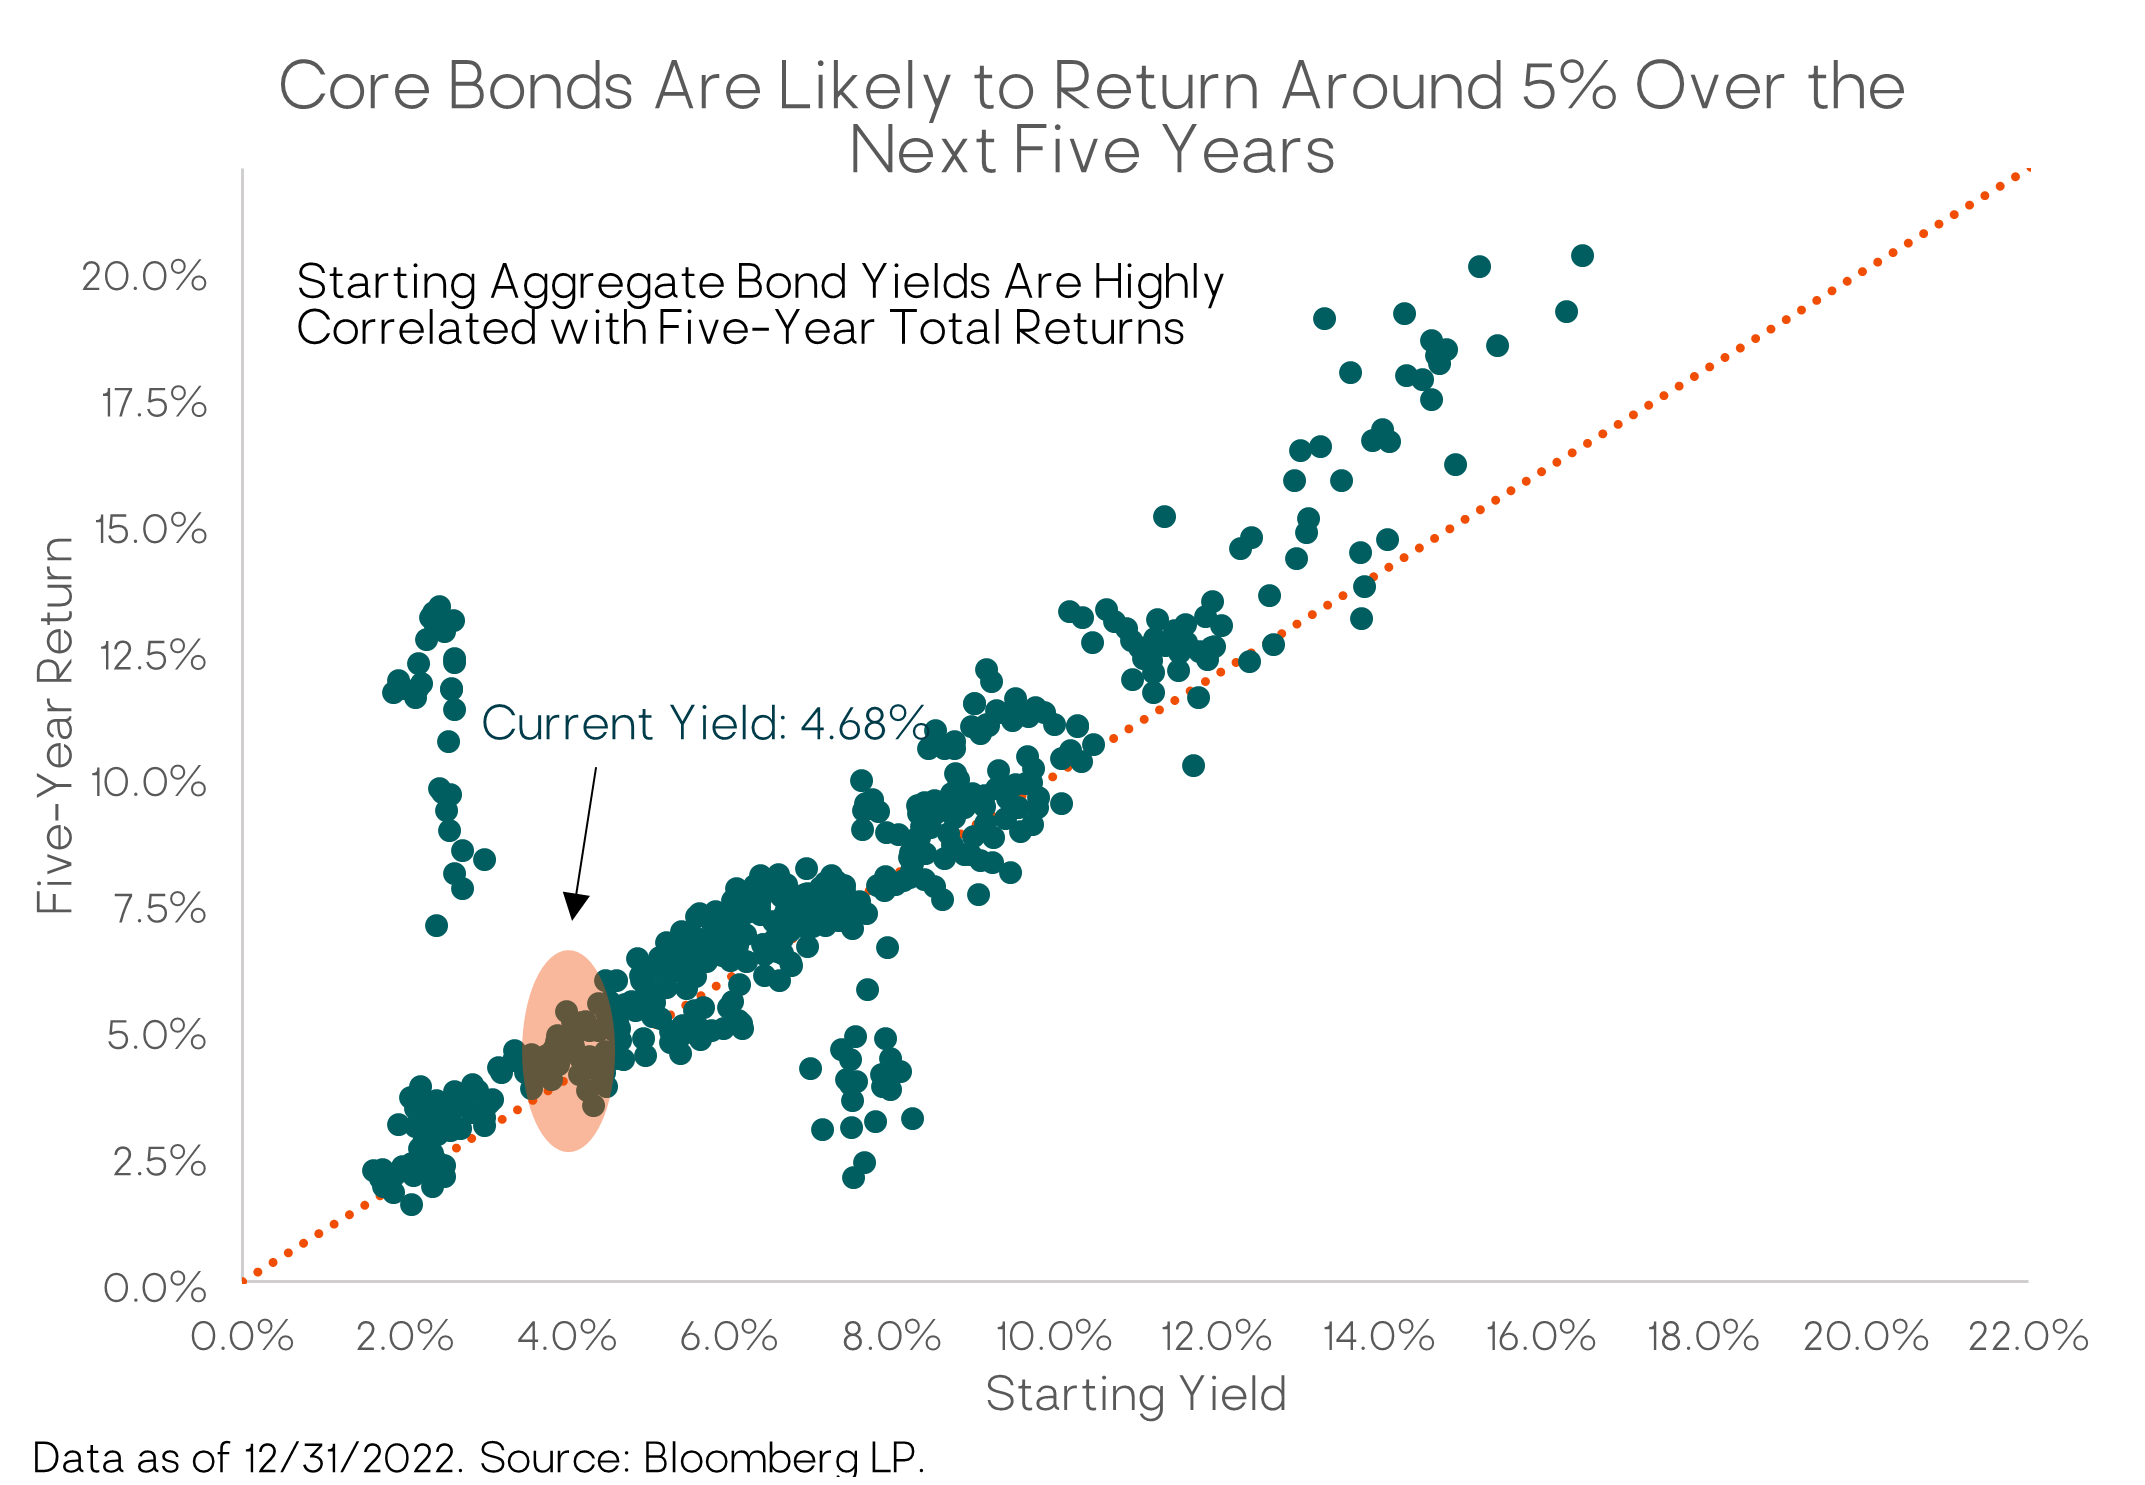
At year-end, the Agg was yielding 4.7%. Our base-case return assumption for core bonds over a five-year investment horizon is now slightly above 5.0%. This assumes a slightly lower Agg bond yield from today’s level, implying some capital appreciation in addition to the current yield. In our bearish macro scenario, where Treasury and Aggregate bond yields move lower, we estimate that core bonds will generate a 5.6% annualized return. (This bearish scenario for stocks is a bullish scenario for core bonds.) Lastly, in our bullish macro scenario, core bonds return approximately 5.25%. We also consider an environment where inflation remains stubbornly high and/or the Fed increases rates higher than consensus expects. In this scenario, we would still expect core bonds to generate a return in the high 4% range.
While these five-year expected returns fall within a narrow range, our shorter-term (12-month) return estimates have much wider variance. In a base-case scenario, we think core bond returns could be in the 4.5% range, plus or minus 50 basis points, while our bearish and optimistic scenario returns range from 1% to 8%.
We expect core bonds to deliver a positive return if a recession plays out, providing valuable portfolio ballast while riskier assets such as equities get hit. For example, if the 10-year Treasury yield were to decline 75 bps (to 3.10%) over the next 12 months, we estimate the core bond index would return close to 9% (from yield plus price gains).
Our core bond allocation also acts as “dry powder” that we can tactically allocate into stocks and other higher-returning assets at much more attractive (lower) prices.
High-Yield Bonds
We look for high-yield bond returns in the mid-single-digit range over our five-year investment horizon in most of our scenarios. Our base case is that returns will be in the mid-4% range, with returns in the bear and bull cases ranging from 4.3% to 6.1%, respectively. As we consider shorter-term returns, our 2023 base case for high-yield is just shy of 8.0%. In an optimistic 12-month scenario, we think high-yield could generate low-double-digit returns. In a negative scenario where we assume yields increase and spreads widen modestly, we estimate returns would be relatively flat over a 12-month period. (We have direct positions in some of our portfolios and many of our flexible bond fund managers include high-yield as part of their opportunity set.)
Investment-Grade Corporate Bonds
Our base-case expectation for 5-year returns for investment-grade corporate bonds is just over 5%. This estimate factors in changes to interest-rates in addition to changes in corporate bond spreads relative to Treasuries. In a bullish scenario, we think 5-year annualized returns will be in the 5.6% range, while in a bearish scenario, we think returns will be in a similar range. While the results for the bearish and bullish scenarios are similar, we get there in different ways. The bearish scenario benefits from duration as rates move lower (bond prices rise), which is offset somewhat by widening spreads relative to Treasuries. The opposite is true for the bullish scenario.
Over the next year, we think it’s possible for investment-grade corporate bonds to have a 7.5% to 8% return through some modest spread compression. Returns could get even more attractive (closer to 10%) through the combination of lower yields and tighter spreads in an optimistic scenario. In a bearish scenario where 10-year Treasury yields rise back to their 2022 highs and credit spreads widen modestly, returns over a 12-month period would likely be modestly positive.
Portfolio Positioning
Weighing the macro and market evidence we are maintaining our slight underweight to global equities relative to our long-term strategic allocations, with a modest tactical tilt toward EM stocks given their attractive medium-term return potential.
Core bonds have become more attractive this year given their higher yield, and we increased our target allocation to them in September. We also continue to have a meaningful allocation to higher-yielding, actively managed, flexible bond funds run by experienced teams with broad investment opportunity sets. As highlighted above, there are fixed-income sectors outside of core bonds that offer attractive risk-return potential, and we want to access them via our active managers.
Finally, we maintain core positions in trend-following managed futures and other marketable (liquid) alternatives. Managed futures returns were strongly positive in 2022 as traditional bonds and stocks, the building blocks of many portfolios, saw large declines. These alternative strategies, with their differing sources of return and risk, should continue to provide tactical and longer-term strategic benefits to our balanced portfolios. They are much less dependent than traditional investments on the type of macro regime that unfolds over the coming years (e.g., deflation, stagflation, inflation, or growth).
Closing Thoughts
As 2022 has reminded investors, we should expect the unexpected, and expect to be surprised. This is expressed in our portfolio construction and investment management via balanced risk exposures, diversification and forward-looking analysis that considers a wide range of potential scenarios and outcomes.
We believe 2023 will present us with some excellent long-term investment opportunities. Although in our base case we also expect we’ll first have to go through a recessionary bear market with possibly significant volatility including further declines in global equity prices.
While challenging, it is important for long-term investors to stay committed to their strategy through rough periods in the markets. Riding out shorter-term turbulence and discomfort is necessary to earn the long-term “equity risk premium” – the additional return from owning riskier “growth assets” (such as stocks) that most investors need to build long-term wealth and achieve their financial objectives. We’ve paid some of that price so far, and there may be more to come, but what doesn’t change is the long-term reward that comes from being disciplined and opportunistic.
Outside of the U.S. stock market, we already see attractive medium-term expected returns from international and emerging markets stocks. (With a recession they will likely get more attractive.) A declining dollar, as we expect over the medium-term, would further fuel non-U.S. equity returns.
Fixed-income assets and high-quality bonds are also now reasonably priced with mid-single digit or better expected returns. Core bonds will also provide valuable portfolio ballast in the event of a 2023 recession. Our investments in alternative strategies and trend-following managed futures strategies provide further resilience to our portfolios no matter how the next year (and years) play out.
We sincerely appreciate your continued confidence and trust, and wish you and yours a healthy, happy, and prosperous New Year.
– Litman Gregory Investment Team
Important Disclosure
This written communication is limited to the dissemination of general information pertaining to Litman Gregory Wealth Management, LLC (“LGWM”), including information about LGWM’s investment advisory services, investment philosophy, and general economic market conditions. This communication contains general information that is not suitable for everyone. The information contained herein should not be construed as personalized investment advice and should not be considered as a solicitation to buy or sell any security or engage in a particular investment strategy.
There is no agreement or understanding that LGWM will provide individual advice to any investor or advisory client in receipt of this document. Certain information constitutes “forward-looking statements” and due to various risks and uncertainties actual events or results may differ from those projected. Some information contained in this report may be derived from sources that we believe to be reliable; however, we do not guarantee the accuracy or timeliness of such information.
Past performance is no guarantee of future results, and there is no guarantee that the views and opinions expressed in this newsletter will come to pass. Individual client needs, asset allocations, and investment strategies differ based on a variety of factors.
Investing involves risk, including the potential loss of principal. Any reference to a market index is included for illustrative purposes only, as it is not possible to directly invest in an index. Indices are unmanaged, hypothetical vehicles that serve as market indicators and do not account for the deduction of management feeds or transaction costs generally associated with investable products, which otherwise have the effect of reducing the performance of an actual investment portfolio.
Nothing herein should be construed as legal or tax advice, and you should consult with a qualified attorney or tax professional before taking any action. Information presented herein is subject to change without notice.
A list of all recommendations made by LWM within the immediately preceding one year is available upon request at no charge. For additional information about LGWM, please consult the Firm’s Form ADV disclosure documents, the most recent versions of which are available on the SEC’s Investment Adviser Public Disclosure website (adviserinfo.sec.gov) and may otherwise be made available upon written request to compliance@lgam.com
LGWM is an SEC registered investment adviser with its principal place of business in the state of California. LGWM and its representatives are in compliance with the current registration and notice filing requirements imposed upon registered investment advisers by those states in which LGWM maintains clients. LGWM may only transact business in those states in which it is noticed filed, or qualifies for an exemption or exclusion from notice filing requirements. Any subsequent, direct communication by LGWM with a prospective client shall be conducted by a representative that is either registered or qualifies for an exemption or exclusion from registration in the state where the prospective client resides.
Any reference to a market index is included for illustrative purposes only, as it is not possible to directly invest in an index. Indices are unmanaged, hypothetical vehicles that serve as market indicators and do not account for the deduction of management feeds or transaction costs generally associated with investable products, which otherwise have the effect of reducing the performance of an actual investment portfolio.
The Standard & Poor’s 500 Composite Stock Price Index is a capitalization-weighted index of 500 stocks intended to be a representative sample of leading companies in leading industries within the U.S. economy. Stocks in the Index are chosen for market size, liquidity, and industry group representation.
The MSCI ACWI Index represents the performance of large- and mid-cap stocks across 23 developed and 24 emerging markets. The index covers 2,900 constituents across 11 sectors and approximately 85% of the free float-adjusted market capitalization in each market.
The MSCI EAFE Index is an equity index which captures large and mid-cap representation across 21 Developed Markets countries* around the world, excluding the US and Canada. With 799 constituents, the index covers approximately 85% of the free float- adjusted market capitalization in each country.
The MSCI Emerging Markets Index is a free float-adjusted market capitalization index that is designed to measure equity market performance of emerging markets. The MSCI Emerging Markets Index consists of the following 23 emerging market country indexes: Brazil, Chile, China, Colombia, Czech Republic, Egypt, Greece, Hungary, India, Indonesia, Korea, Malaysia, Mexico, Peru, Philippines, Poland, Qatar, Russia, South Africa, Taiwan, Thailand, Turkey and the United Arab Emirates.
The Bloomberg U.S. Aggregate Bond Index is a broad-based benchmark that measures the investment grade, U.S. dollar- denominated, fixed-rate taxable bond market.
The US High-Yield Market Index is a US Dollar-denominated index which measures the performance of high-yield debt issued by corporations domiciled in the US or Canada.
The ICE BofA US High Yield Index is market capitalization weighted and is designed to measure the performance of U.S. dollar denominated below investment grade (commonly referred to as “junk”) corporate debt publicly issued in the U.S. domestic market.
The ICE U.S. Dollar Index is a geometrically averaged calculation of six currencies weighted against the U.S. dollar.
The SG CTA Trend Sub-Index is a subset of the SG CTA Index, and follows traders of trend following methodologies. The SG CTA Index is equal weighted, calculates the daily rate of return for a pool of CTAs selected from the larger managers that are open to new investment.
Alternative Strategies (HFRX Global Hedge Fund Index). The HFRX Global Hedge Fund Index is designed to be representative of the overall composition of the hedge fund universe. It is comprised of all eligible hedge fund strategies; including but not limited to convertible arbitrage, distressed securities, equity hedge, equity market neutral, event driven, macro, merger arbitrage, and relative value arbitrage. The strategies are asset weighted based on the distribution of assets in the hedge fund industry. Hedge Fund Research, Inc. (HFR) utilizes a UCITSIII compliant methodology to construct the HFRX Hedge Fund Indices.
Managed Futures (Credit Suisse Managed Futures Hedge Fund Index). The Credit Suisse Managed Futures Hedge Fund Index is designed to broadly represent the performance of Managed Futures hedge funds (in contrast to CTA programs) in the Credit Suisse database representing at least 85% of total Managed Futures hedge fund assets under management. To qualify for inclusion in the index, a fund must provide audited financials, have a minimum $50 million in assets, have a minimum one year of performance history, and consistently report to the database.
Estimated Returns Disclosure
Scenario Definitions:
Downside: The economy falls into a deep and sustained recession for any of various reasons, such as deleveraging/deflation, unexpected systemic shock, geopolitical conflict, Fed or fiscal policy error, etc. At the end of our five-year tactical horizon, S&P 500 earnings are below their normalized trend and valuation multiples are below-average reflecting investor risk aversion. Inflation and 10-year Treasury nominal and real yields are very depressed.
Base: Consistent with long-term economic and market history, reflecting economic and earnings growth cycles that are interspersed with recessions around an upward sloping normalized growth trendline. Inflation is at or moderately higher than the Fed’s 2% target level and 10-year Treasury real yields are around zero percent to slightly positive. For the S&P 500, we now bookend our base case with a lower-end and upper-end estimate:
-
At the lower end of our base-case fair-value range, reflation efforts are successful and nominal economic growth is higher than the average. However, the economy overheats, and valuation multiple and some margin compression largely offset the favorable macro backdrop.
-
At the upper end, reflation efforts are also successful, nominal economic growth is higher than observed since the 2008 financial crisis on average, profit margins move slightly higher, and valuation multiples are also slightly higher than the recent historical average.