Second Quarter 2023 Investment Commentary
Second Quarter 2023 Market Recap
Global equities continued to rally in the second quarter of the year, led again by surging U.S. mega-cap tech/growth stocks, particularly anything artificial intelligence (AI) related.
The S&P 500 index gained 6.6% in June and 8.7% in the second quarter, driving its year-to-date (YTD) return to 16.9%. Developed international stocks (MSCI EAFE Index) rallied 4.6% in June, gaining 3% for the quarter and 11.7% YTD. Emerging markets stocks (MSCI EM Index) rose 3.8% in June, resulting a 0.9% gain for the second quarter and an 4.9% return YTD.
Tech stocks continued their incredible comeback after a terrible 2022. The Nasdaq Composite rose over 13% for the quarter and is up over 32% YTD. The Russell 1000 Growth Index is up 29% on the year, versus a measly 5.1% gain for the Russell 1000 Value Index.
The market-cap-weighted S&P 500 Index’s rally this year has been the “narrowest” on record, with less than 28% of the index’s constituents beating the overall index return (through June 14). As shown in the Ned Davis Research chart below, in an average year around 49% of the index’s 500 companies beat the overall index. (The only other year comparable to this year was 1998, as the tech/internet stock bubble was inflating. That didn’t end well, but it took another 15 months before it started to burst.)
The “Narrowest” Stock Market in At Least 50 Years
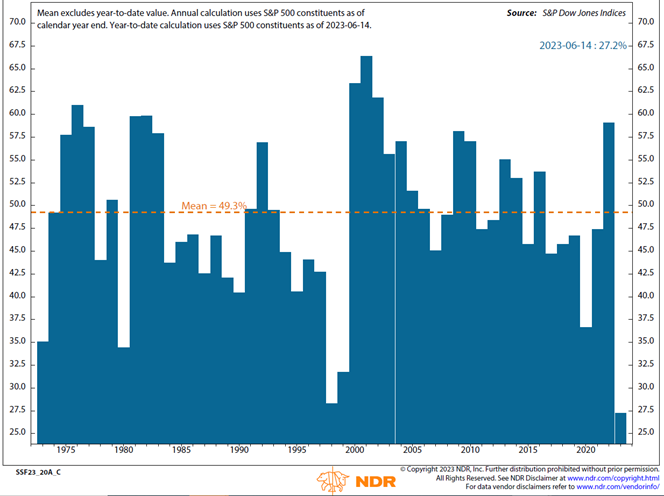
More granularly, with the sudden frenzy in all things AI, the average YTD return for Amazon, Google, Meta, Microsoft, NVIDIA, and Tesla is 96%, contributing almost the entire S&P 500 return for the year. The combined market cap of the seven largest companies in the S&P 500 (all the above plus Apple, the so called “Magnificent Seven”) now comprises over 27% of the total index, the largest share in history for the top seven.
However, in a possible indication the market rally is broadening, the small-cap Russell 2000 Index shot up 8.1% in June (and is up the same amount YTD), while the large-cap Russell 1000 Value and 1000 Growth indexes had similar ~7% returns in June. It remains to be seen whether this extremely narrow market rally resolves via the rest of the market catching up or the so-called Magnificent Seven “catching down,” but improved market breadth would be a positive indicator for the market’s continued bull run.
Moving to the fixed-income markets, core bond returns (Bloomberg U.S. Aggregate Bond Index) were slightly negative for the quarter as interest rates slightly rose/prices fell. The yield of the benchmark 10-year Treasury ended the second quarter at 3.8%, up from 3.5% at the end of March. Riskier high-yield bonds (ICE BofA U.S. High Yield Index) gained 1.6% for the quarter and are up 5.4% YTD. Municipal bonds (Bloomberg Municipal 1-15 year index) were generally flat on the quarter and up 1.9% YTD. Actively managed flexible/nontraditional bond funds gained around 2% and are up over 5% for the year.
Finally, multialternative strategies (Morningstar Multistrategy Category) and trend-following managed futures (SG Trend Index) generally underperformed stocks but outperformed core bonds for the quarter. Trend-following managed futures (SG Trend Index) had a strong rebound after a tough first quarter, gaining around 8%.
Macro Outlook for the Next 6-12 Months: Recession Remains our Base Case with Still a Chance of a Soft Landing
The current macroeconomic data are sending some mixed signals. On the one hand, the U.S. economy has been more resilient than we (and many others) expected through the first half of the year. GDP has grown, albeit at a sub-par rate; the labor market has remained very strong, supporting consumer spending; and headline inflation has dropped meaningfully, thanks largely to a sharp decline in energy prices and consumer goods disinflation as supply and demand normalize after the pandemic disruptions.
On the other hand, key leading indicators of an impending recession are still flashing red (e.g., Conference Board LEI, deeply inverted yield curve, tightening credit conditions). And although the Federal Reserve paused its aggressive interest rate hiking campaign in June, core inflation (excluding food and energy) remains stubbornly high, with the Fed signaling it will resume rate hikes later this year, further raising the likelihood of a recession.
As we read the muddy economic tea leaves through our cloudy crystal ball, we maintain our view that a recession is the most likely outcome over the next few quarters. Historically, the odds are unfavorable for the economy avoiding a recession after the Fed has been aggressively tightening. And we have yet to see the full (lagged) impact of this cycle’s monetary tightening on the real economy.
However, a near-term recession is not a certainty. (1) There are not a lot of historical data points: this is just the 14th Fed tightening cycle since WWII. (2) Each cycle is somewhat different and this one considerably so due to the pandemic dislocations. And (3) there have been three instances (out of 13) where the Fed tightening cycle ended without a recession. (We discuss this further below.)
So, a more benign near-term outcome is certainly possible, and the current growth and inflation trajectory is not inconsistent with that.
But even if it is pushed out beyond the next 12 months, a “normal” business cycle recession is inevitable. We don’t expect a severe 2008 or 2020 type of recession. Household and corporate balance sheets are in good shape, and by raising rates to 5% the Fed now has room to cut them again in the next recession, softening the downturn.
But the business cycle has not been repealed. And as an investor, that’s okay. In fact, it is healthy to periodically clear out speculative excesses and reset expectations and market valuations. As with past cycles, we are confident the economy and financial markets will survive the next recession and go on to higher highs in subsequent cycles, albeit with bumps and dips along the way.
Following are brief updates on the inflation and growth backdrop since Q1.
Inflation
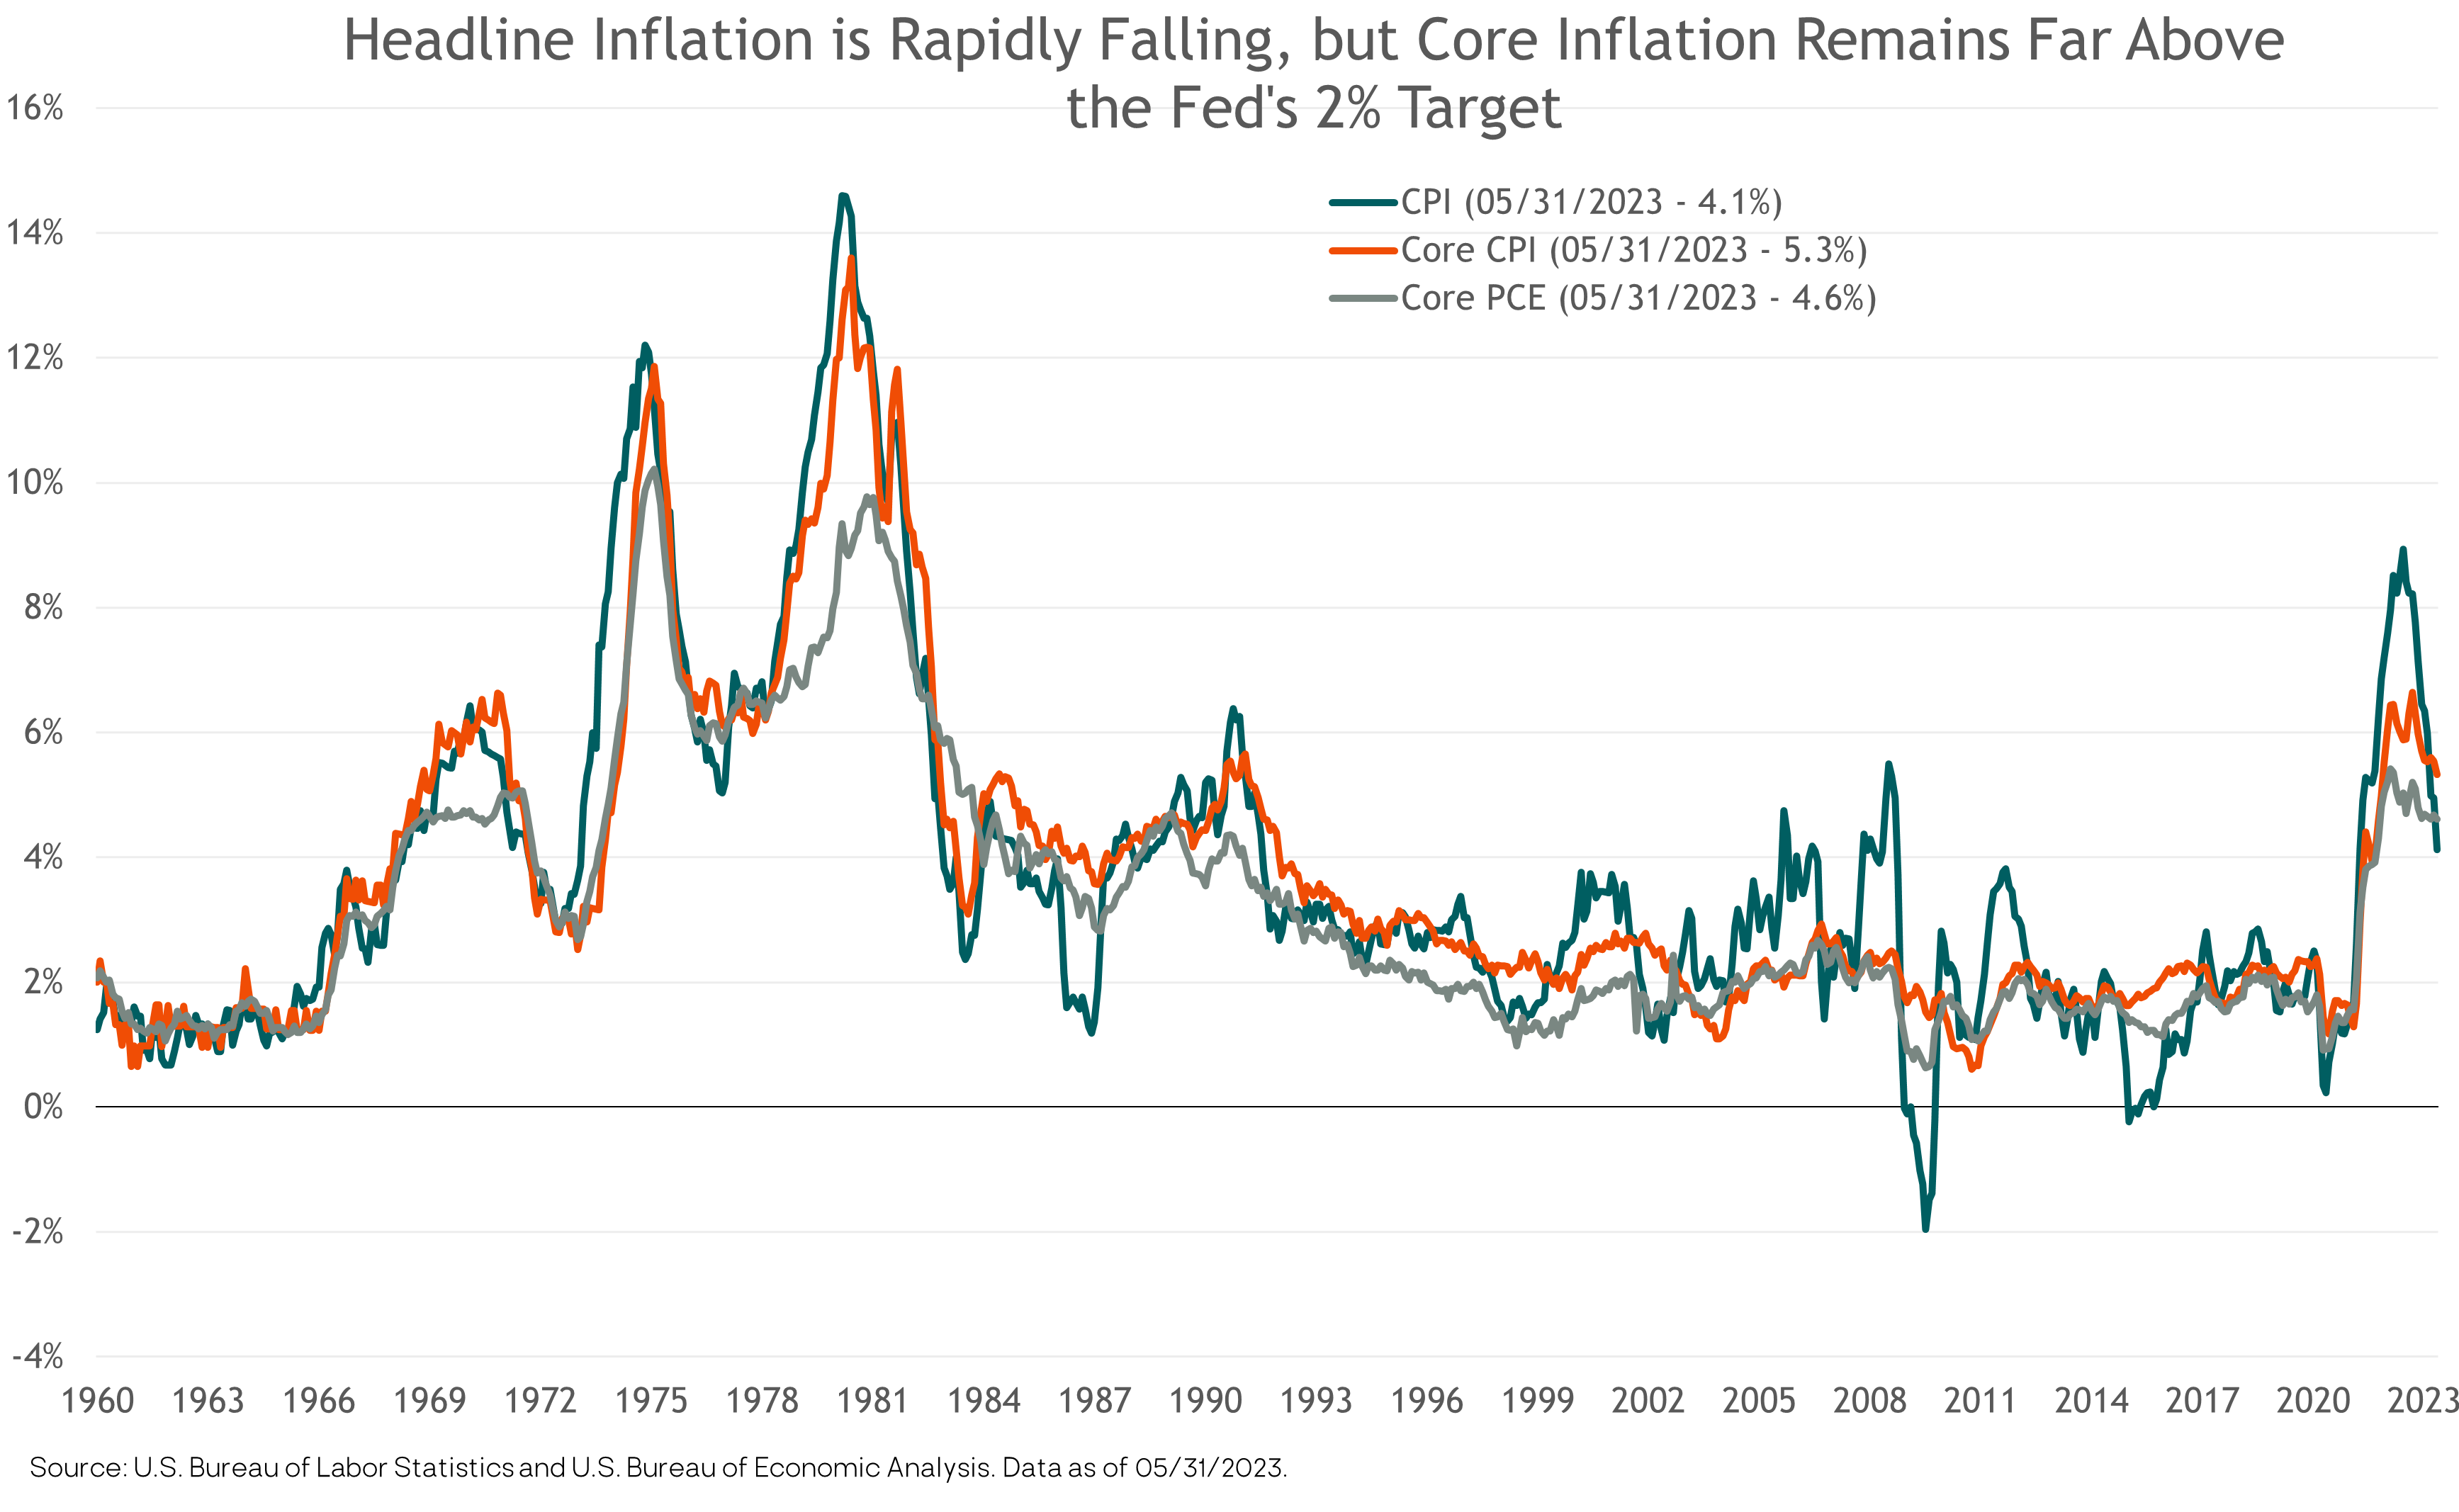
The good news is that “headline” CPI inflation (including energy and food prices) continues to fall, dropping to 4.0% in May on a year-over-year basis. Favorable “base effects” (i.e., compared to prices a year earlier) likely signal further declines in headline CPI over the next few months at least. The annualized inflation rate based on just the past three months’ data is only 2.2%. As noted above, the key driver has been falling energy prices.
Because of the volatility of food and energy prices (what goes down also goes up), the Fed focuses on core inflation, of which there are many measures. But the message is the same no matter which one you choose: core inflation remains stubbornly far above the Fed’s 2% long-term target. The May core CPI inflation rate was 5.3%, and the last three months’ annualized core CPI inflation rate was still very high, at 5%. May core PCE inflation, the Fed’s preferred measure, came in at 4.6.
Most economists expect core inflation to fall as the year goes on, driven by a sharp drop in shelter/rent inflation. Shelter is the largest component of core inflation indexes, comprising over 40% of core CPI and nearly 20% of core PCE. The CPI shelter inflation index measures average rent price changes over the past one-year period and was a whopping 8.0% in May. However, more timely “new-lease” rent price inflation has plunged this year, from mid-teens a year ago to under 2% in May, as shown in the following chart. As these more recent rent prices feed into the shelter inflation calculation, it should pull the core CPI inflation readings materially lower as the year goes on.
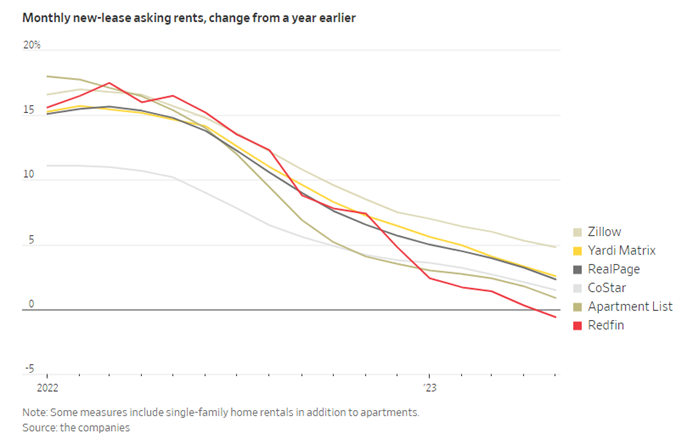
Source: Wall Street Journal. Data as of May 2023.
Fed Chair Powell has also recently emphasized so-called “supercore” inflation, which is core services inflation excluding shelter/rent inflation. Supercore inflation stood at 4.5% year-over-year in May. That’s down from 6.1% in February, but still much too high for the Fed.
The Fed
Despite the still-high core inflation readings, the Fed Open Market Committee (FOMC) unanimously decided not to raise interest rates at its June 14 meeting, after 10 consecutive rate hikes since March 2022 totaling five percentage points (500 basis points). The Fed had signaled this pause was likely coming and the financial markets were expecting it.
However, we’d call it a “hawkish pause” because contrary to expectations the Fed projected 50 basis points (0.5%) of rate hikes later this year. The markets were expecting maybe one more hike at most.
Of course, as we’ve frequently noted, the Fed’s projections of its own behavior are often wrong. No one knows, not even the Fed itself, what it will do three or six months from now. There is too much uncertainty and variability in the economy, at least in the current macro environment.
The Fed also revised up its forecasts for GDP growth, employment, and core inflation for 2023, reflecting the resilience of the economy so far this year and consistent with its projection for further interest rate hikes later this year (the blue lines in the chart below).
A “Hawkish Pause”: The Fed Doesn’t Raise Rates in June, but Projects Two More Hikes Later This Year
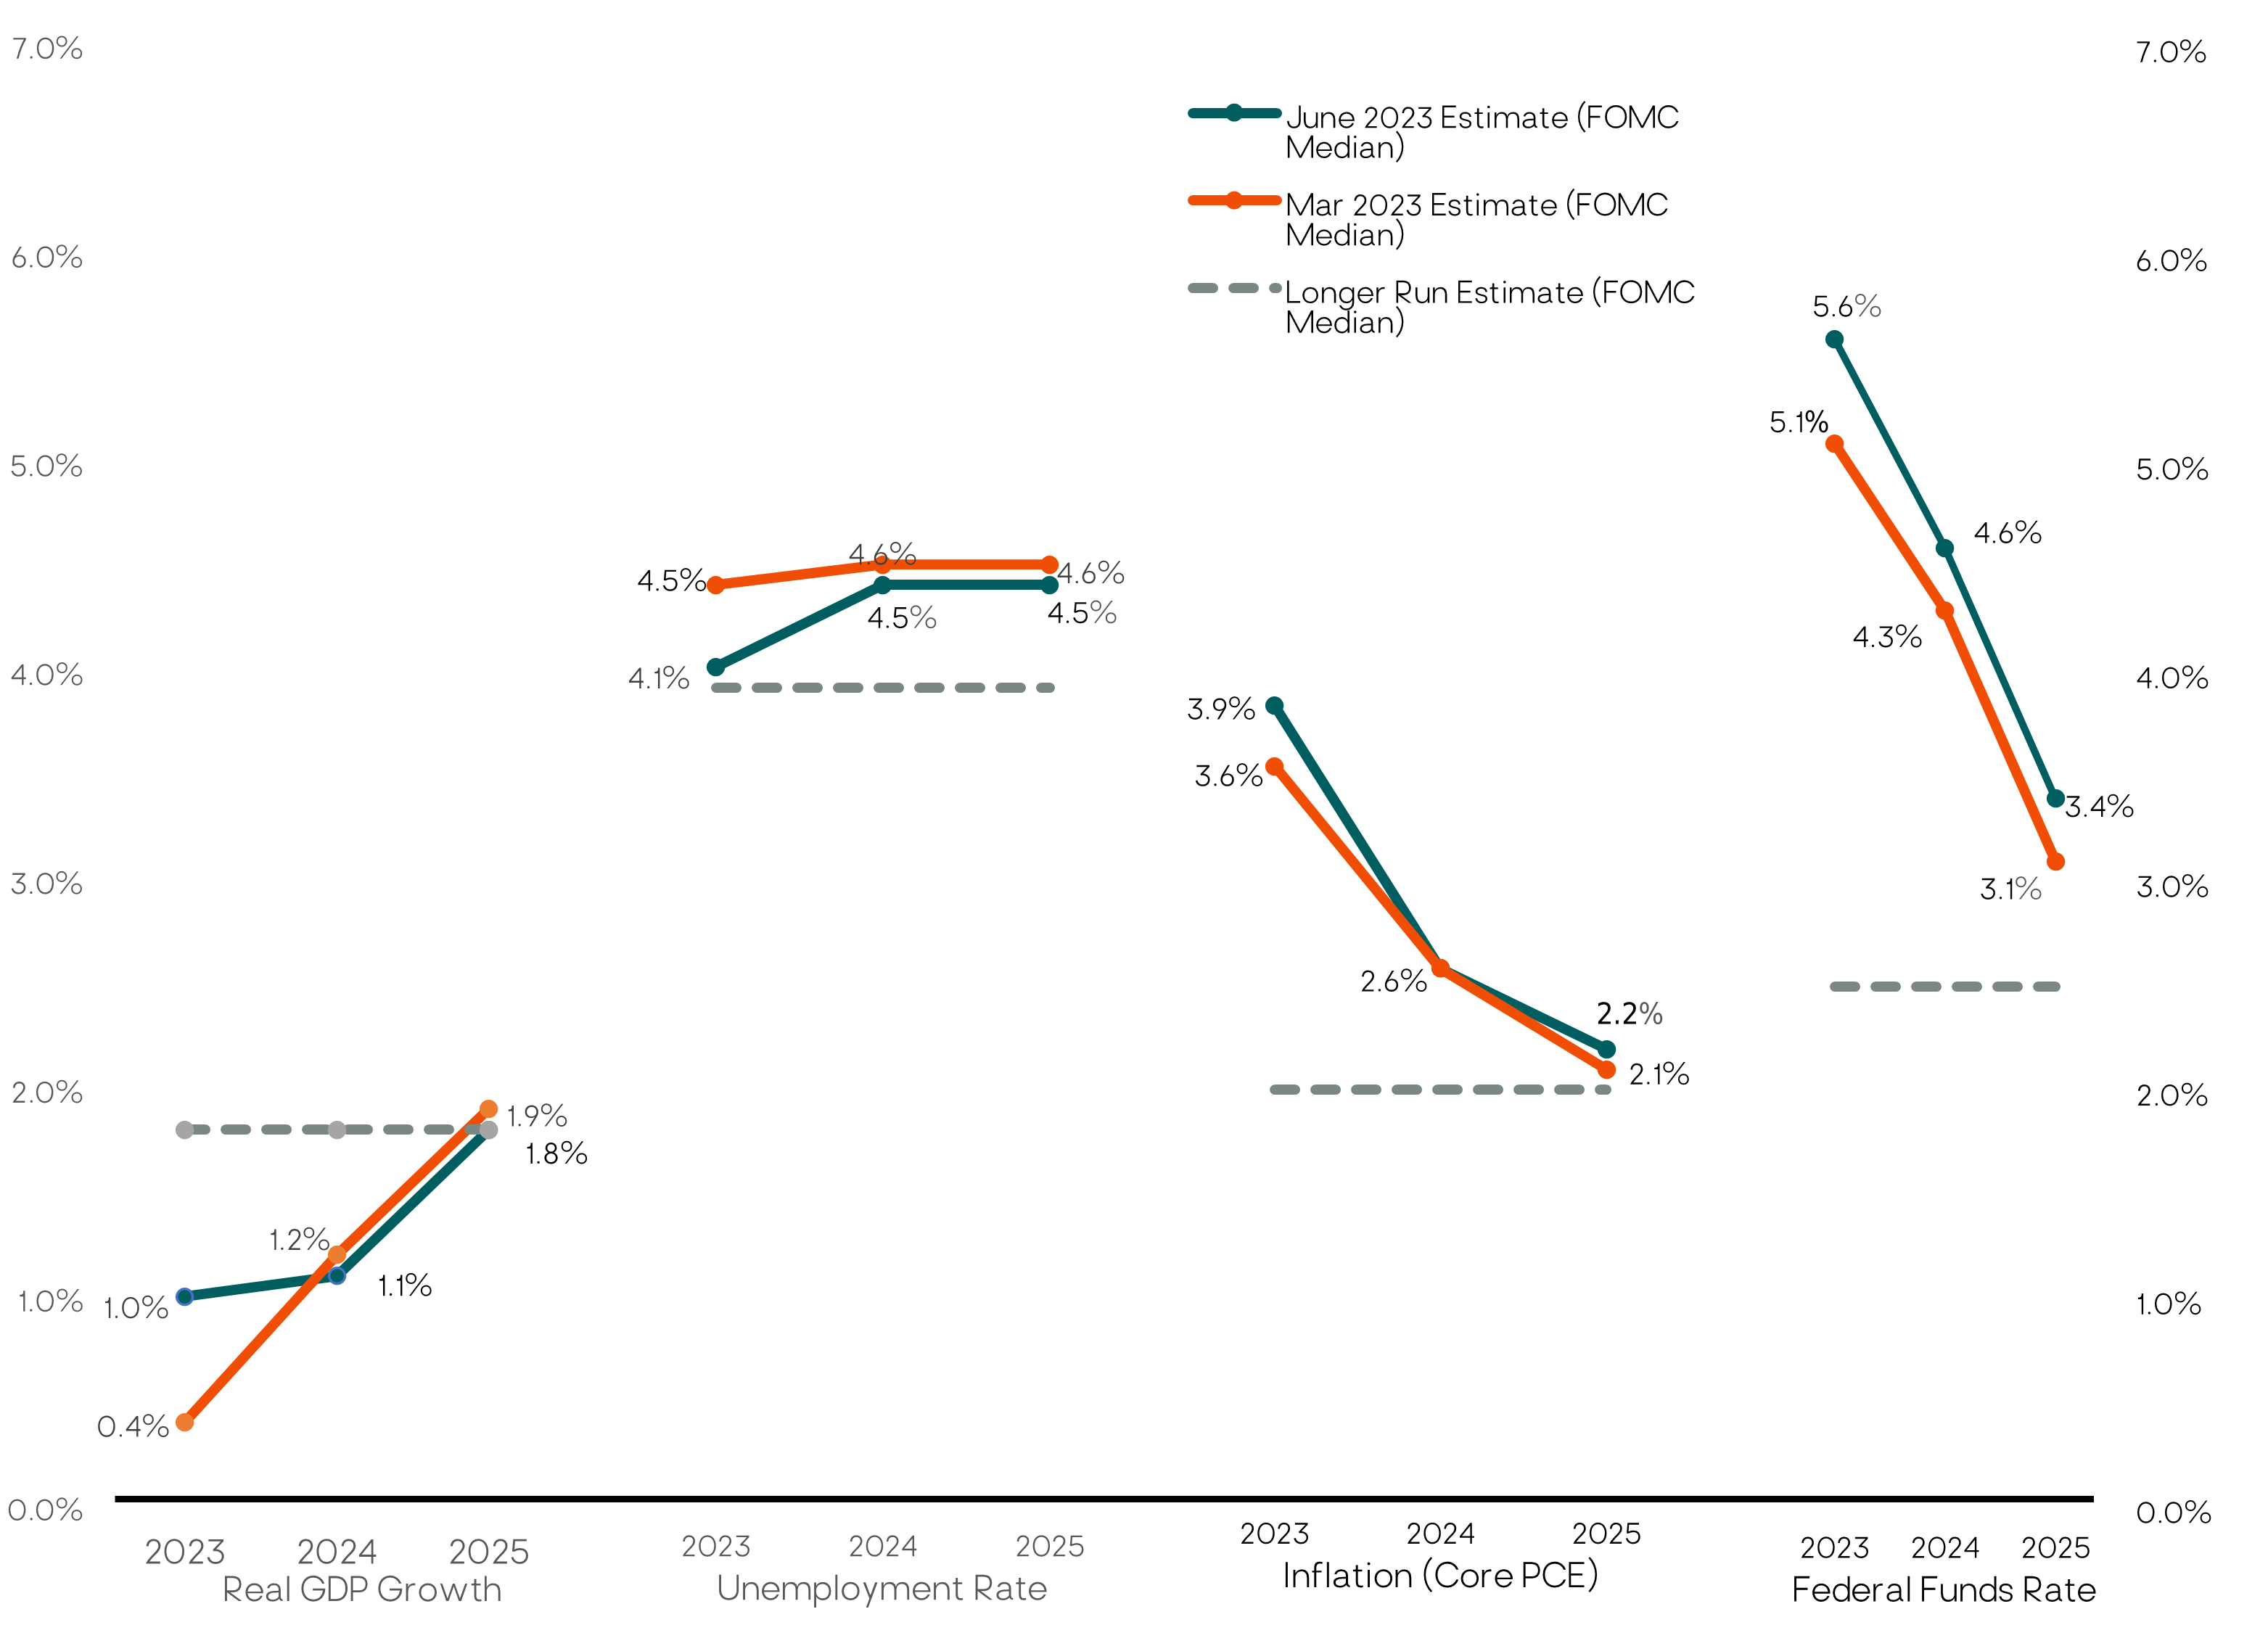
Source: Federal Reserve, Summary of Economic Projections. Data as of June 2023.
At his post-FOMC meeting press conference, Fed Chair Jerome Powell conveyed a hawkish message to those expecting Fed rate cuts any time soon. “Nearly all committee participants view it as likely that some further rate increases will be likely this year,” he said. “Not a single person on the committee wrote down a rate cut this year, nor do I think it is at all likely to be appropriate if you think about it.” Nevertheless, the markets remain skeptical the Fed will actually hike rates twice more.
We think it will take a sharp economic downturn and surging unemployment for the Fed to start cutting rates. But they may continue to hold the Fed funds rate at current levels (or 25 basis points higher) if core inflation drops convincingly towards 2% over the second half of the year.
Meanwhile, the Fed is still hoping they can land the economy softly without causing a recession and a large increase in unemployment. This occurred in the 1965, 1995 and 2018 hiking cycles. But history is not on the Fed’s side. The challenge is daunting given the complexity of the task and the multitude of economic, geo-political and other variables far beyond the Fed’s control.
One can see from the table below that a recession has started an average of 7-8 months after the last Fed rate hike. Based on the historical average, if the Fed’s last rate hike is at the July FOMC meeting, the recession would begin in early 2024.
However, there has been wide dispersion. The lag has been as long as 18 months in the 2007-2008 financial crisis recession. (After they stopped tightening in June 2006, the Fed actually started cutting rates in September 2007 before the recession started in December 2007.) And in the two rate hiking cycles during the inflationary 1970s, both recessions began a few months before the Fed stopped hiking.
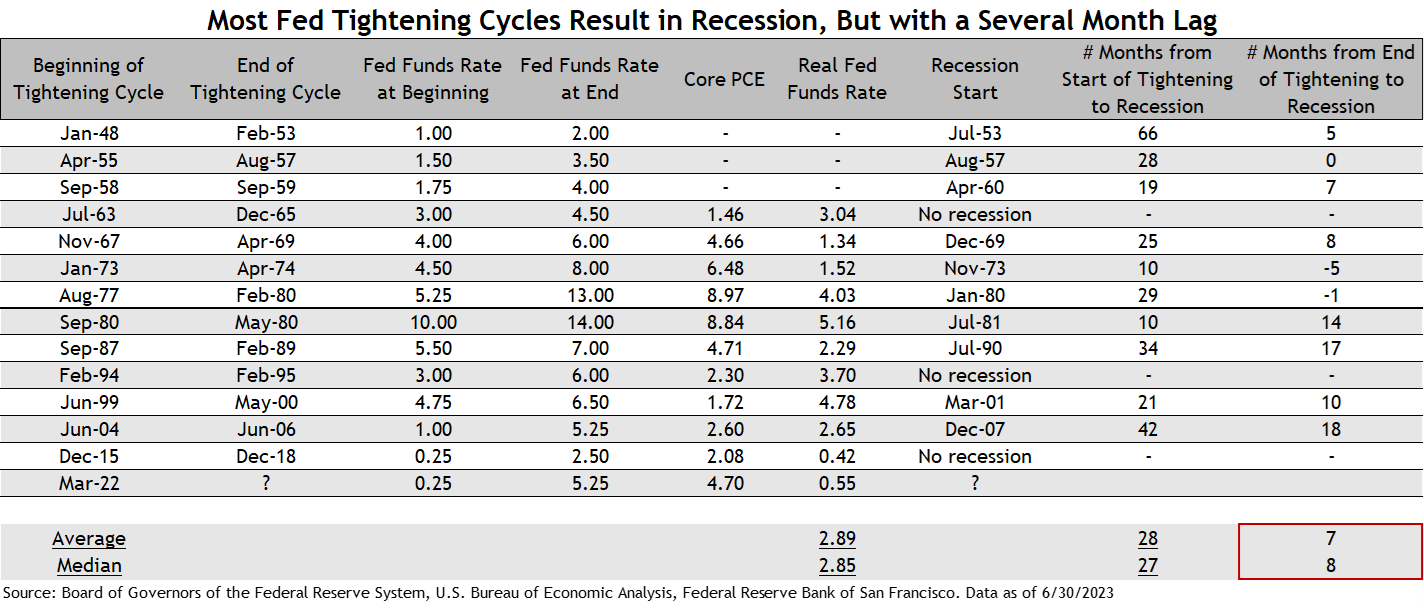
Source: Board of Governors of the Federal Reserve System, U.S. Bureau of Economic Analysis, Federal Reserve Bank of San Francisco. Data as of 6/30/2023
We believe Powell would accept a recession in exchange for bringing inflation sustainably down to the Fed’s 2% target, although the political pressure (from both sides) will ratchet up as we get closer to the November 2024 election.
The Labor Market
Wages and salaries account for 60% of personal income, according to Ned Davis Research, so the strength of the labor market has been key to the strength in consumer spending and the economy’s resilience this year.
On the other side of the coin, the largest input cost for most businesses is wages. Wages in turn are partly a function of inflation expectations, which can feed into a self-reinforcing wage-price spiral — the Fed’s biggest fear.
The good news is that the risk of a wage-price spiral now looks very low. Much like the core inflation readings, wage inflation appears to have peaked and has started to fall. But is still too elevated at around 6%. Annual wage growth of around 3%-4% would be consistent with the Fed’s 2% inflation target, assuming productivity growth of 1%-2%.
The ratio of Job Openings to Unemployed workers is one measure of labor demand versus supply. It remains near all-time highs, with 1.8 job openings per unemployed worker. As shown in the chart below, there is a strong positive relationship between this ratio and wage inflation.
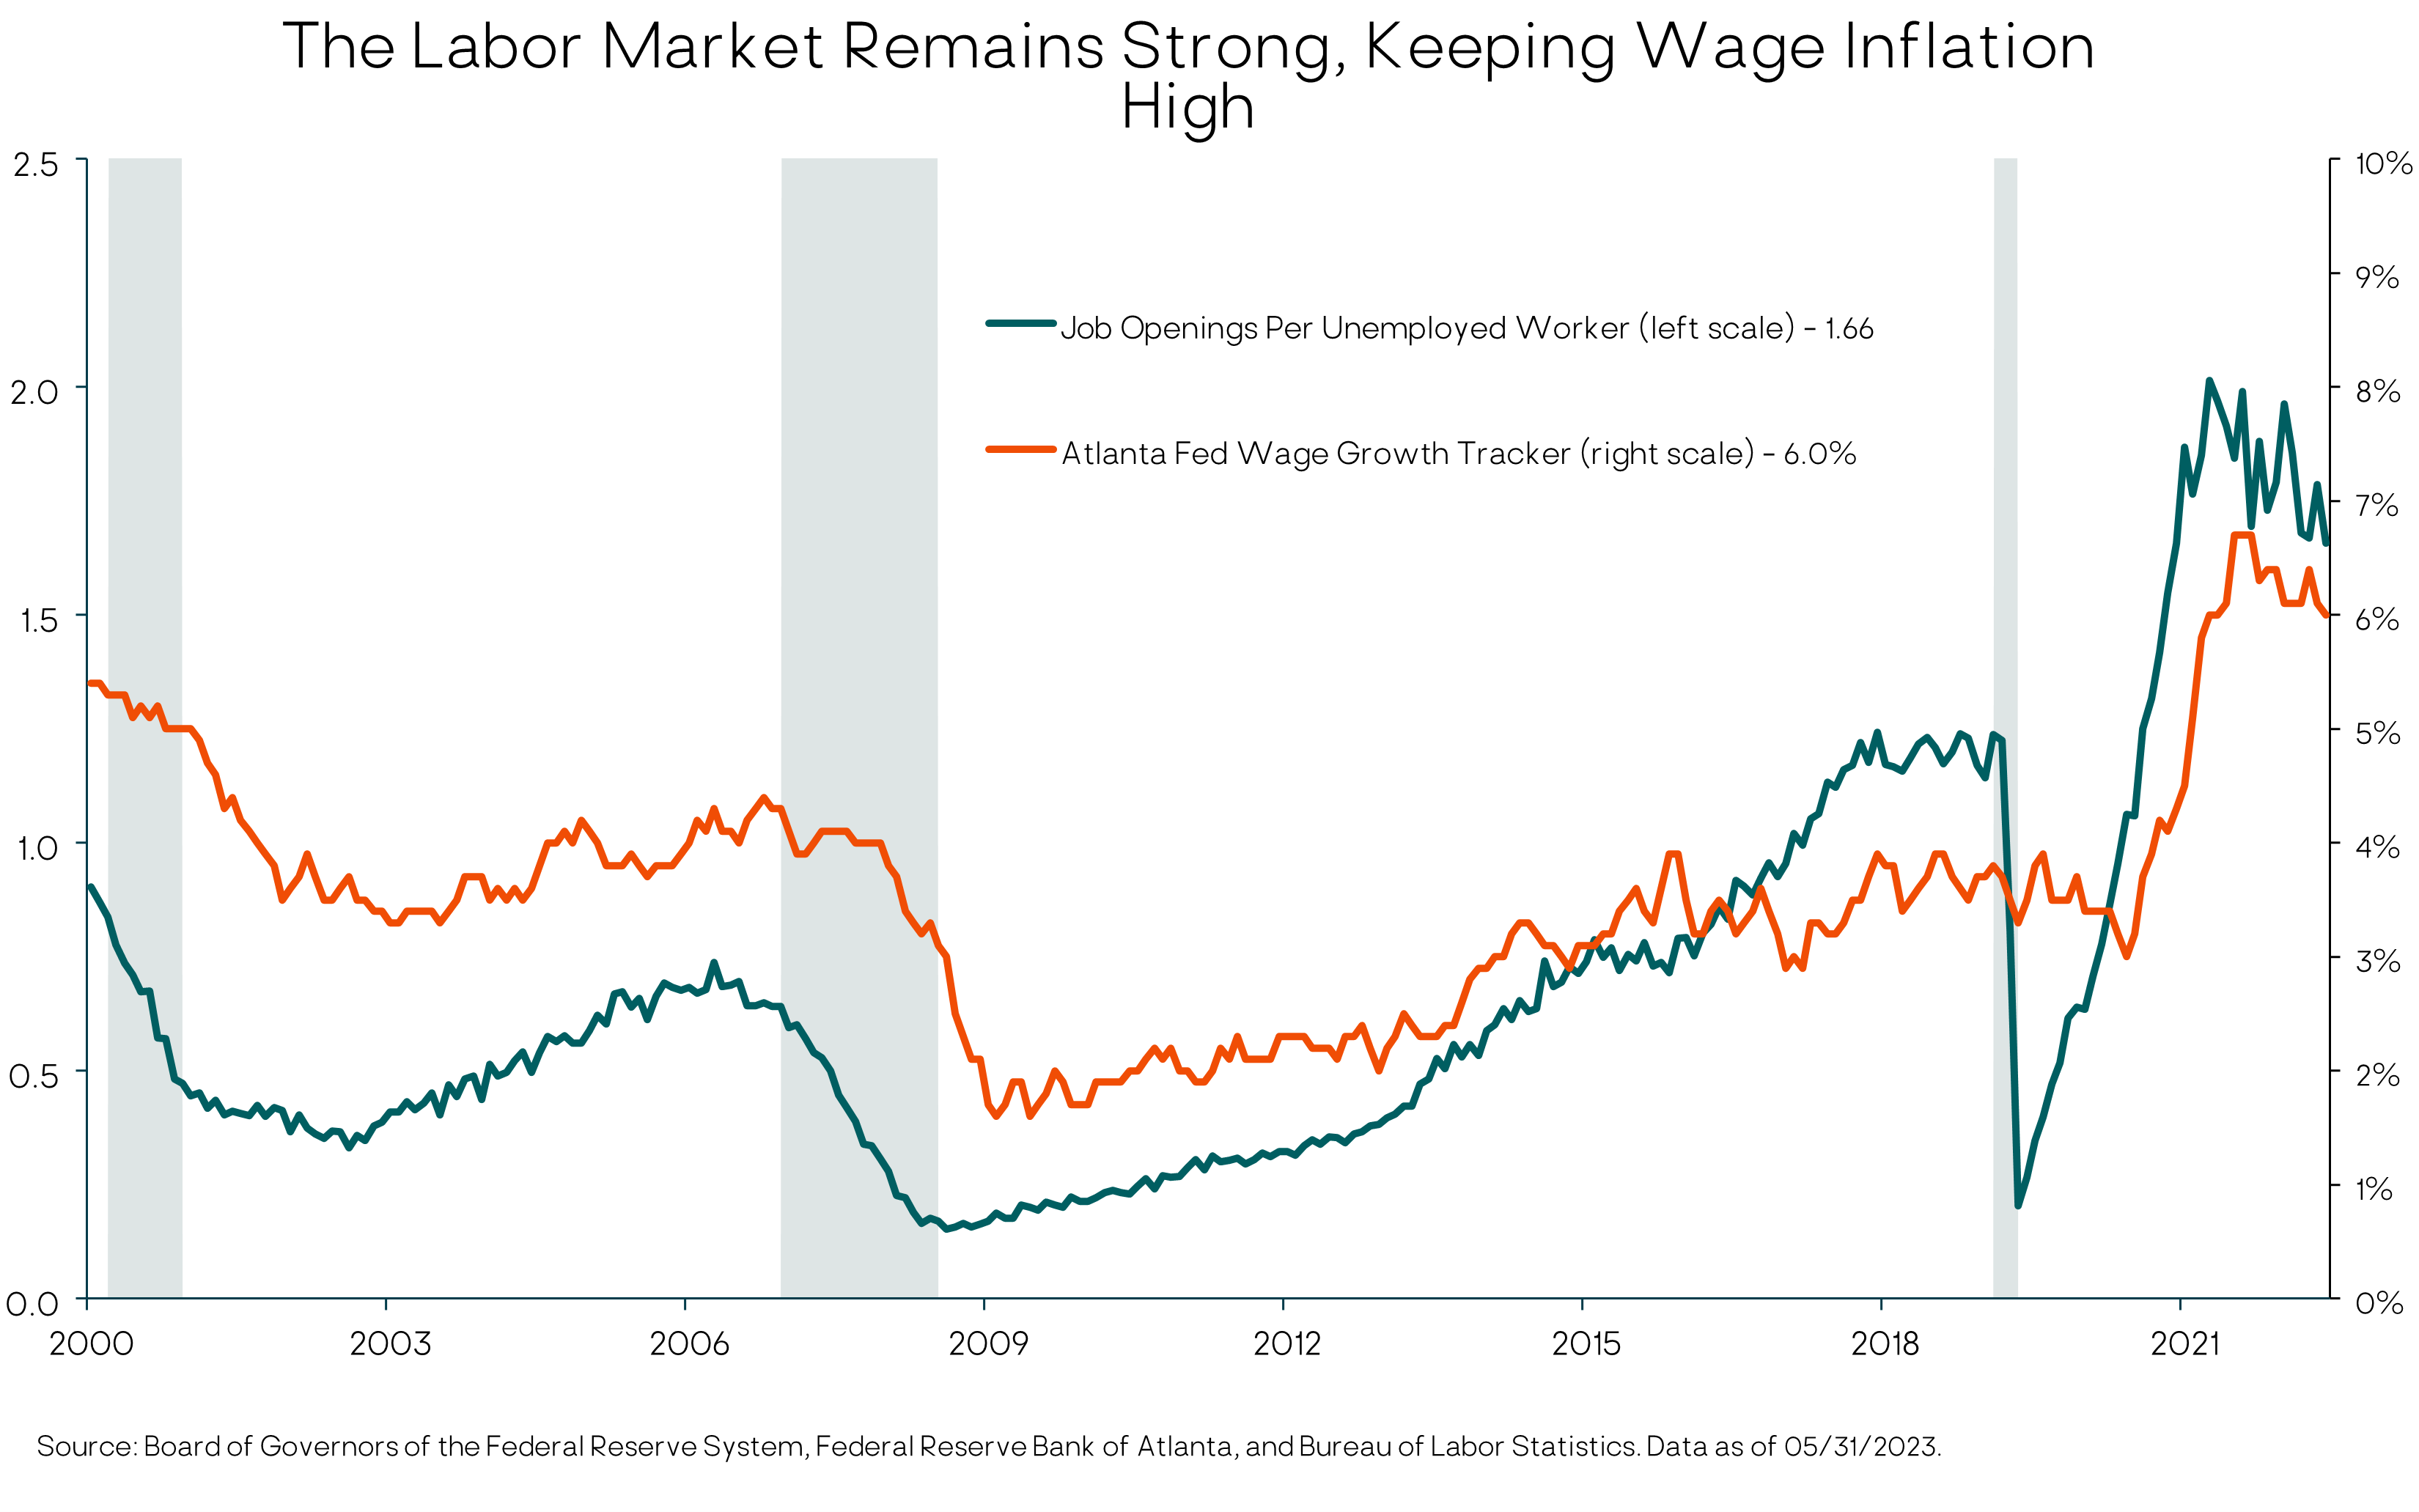
The Fed’s hope is that tighter monetary policy will reduce the number of job openings, relieving pressure on wages without causing a big increase in actual layoffs and unemployment. That’s a possibility given the unprecedented number of job openings relative to very low unemployment. But it’s not our base case.
We’d also point out the Fed itself is projecting roughly a one percentage point increase in the unemployment rate over the next year. The U.S. economy has never experienced more than a 0.5 ppt rise in unemployment from its cyclical low without the economy falling into a recession.
Economic Growth
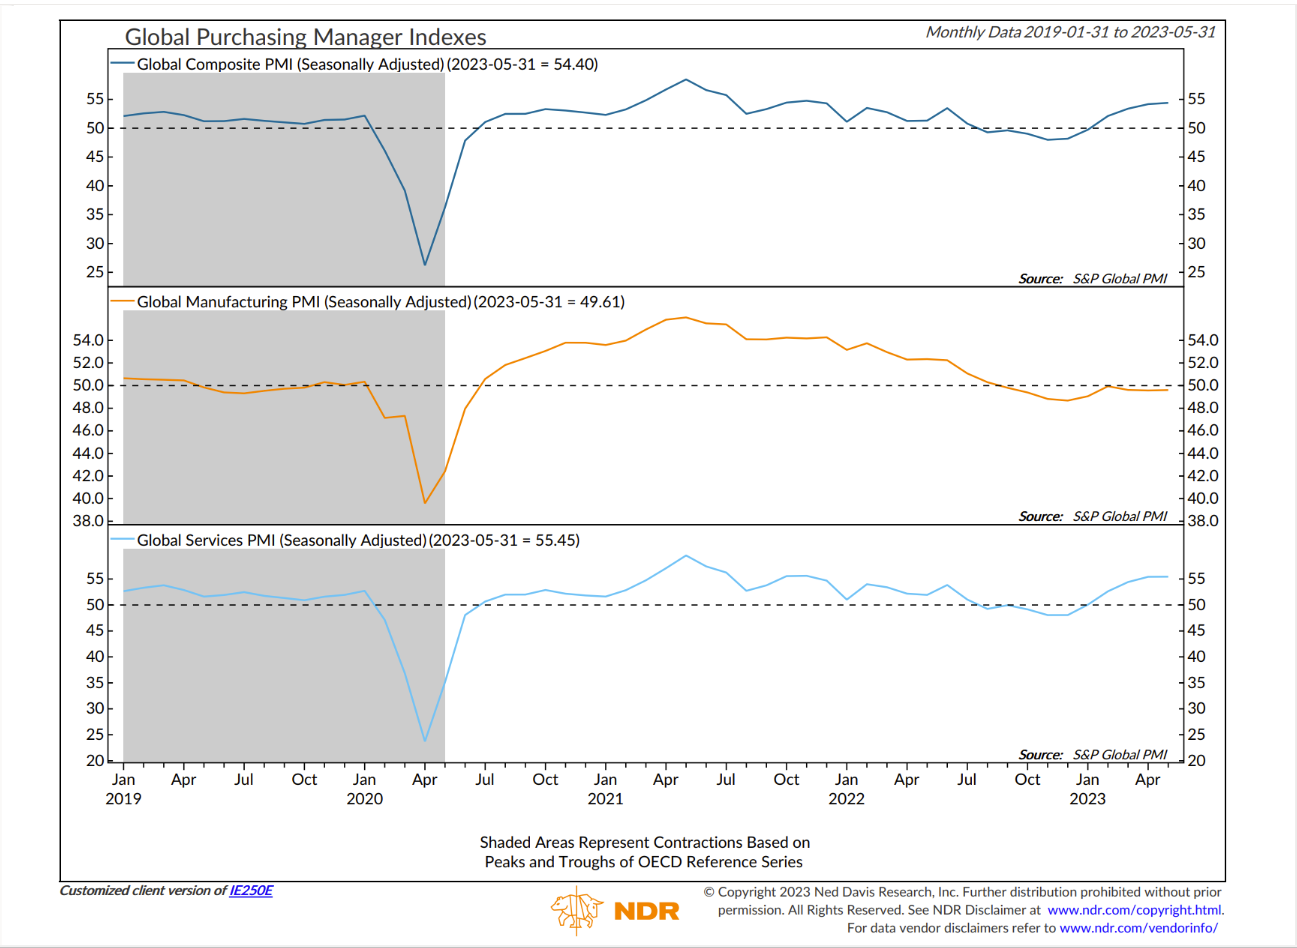
So far this year, the U.S. and global economy have held up better than we expected in our base case, with sub-par (below-potential) growth but no recession. As shown in the chart below, this is due to the continued strength in the Services sector (a PMI above 50 is expansionary), while Manufacturing activity has been contracting.
Resilient Global Growth Due to Strong Services Expansion While Manufacturing Contracts
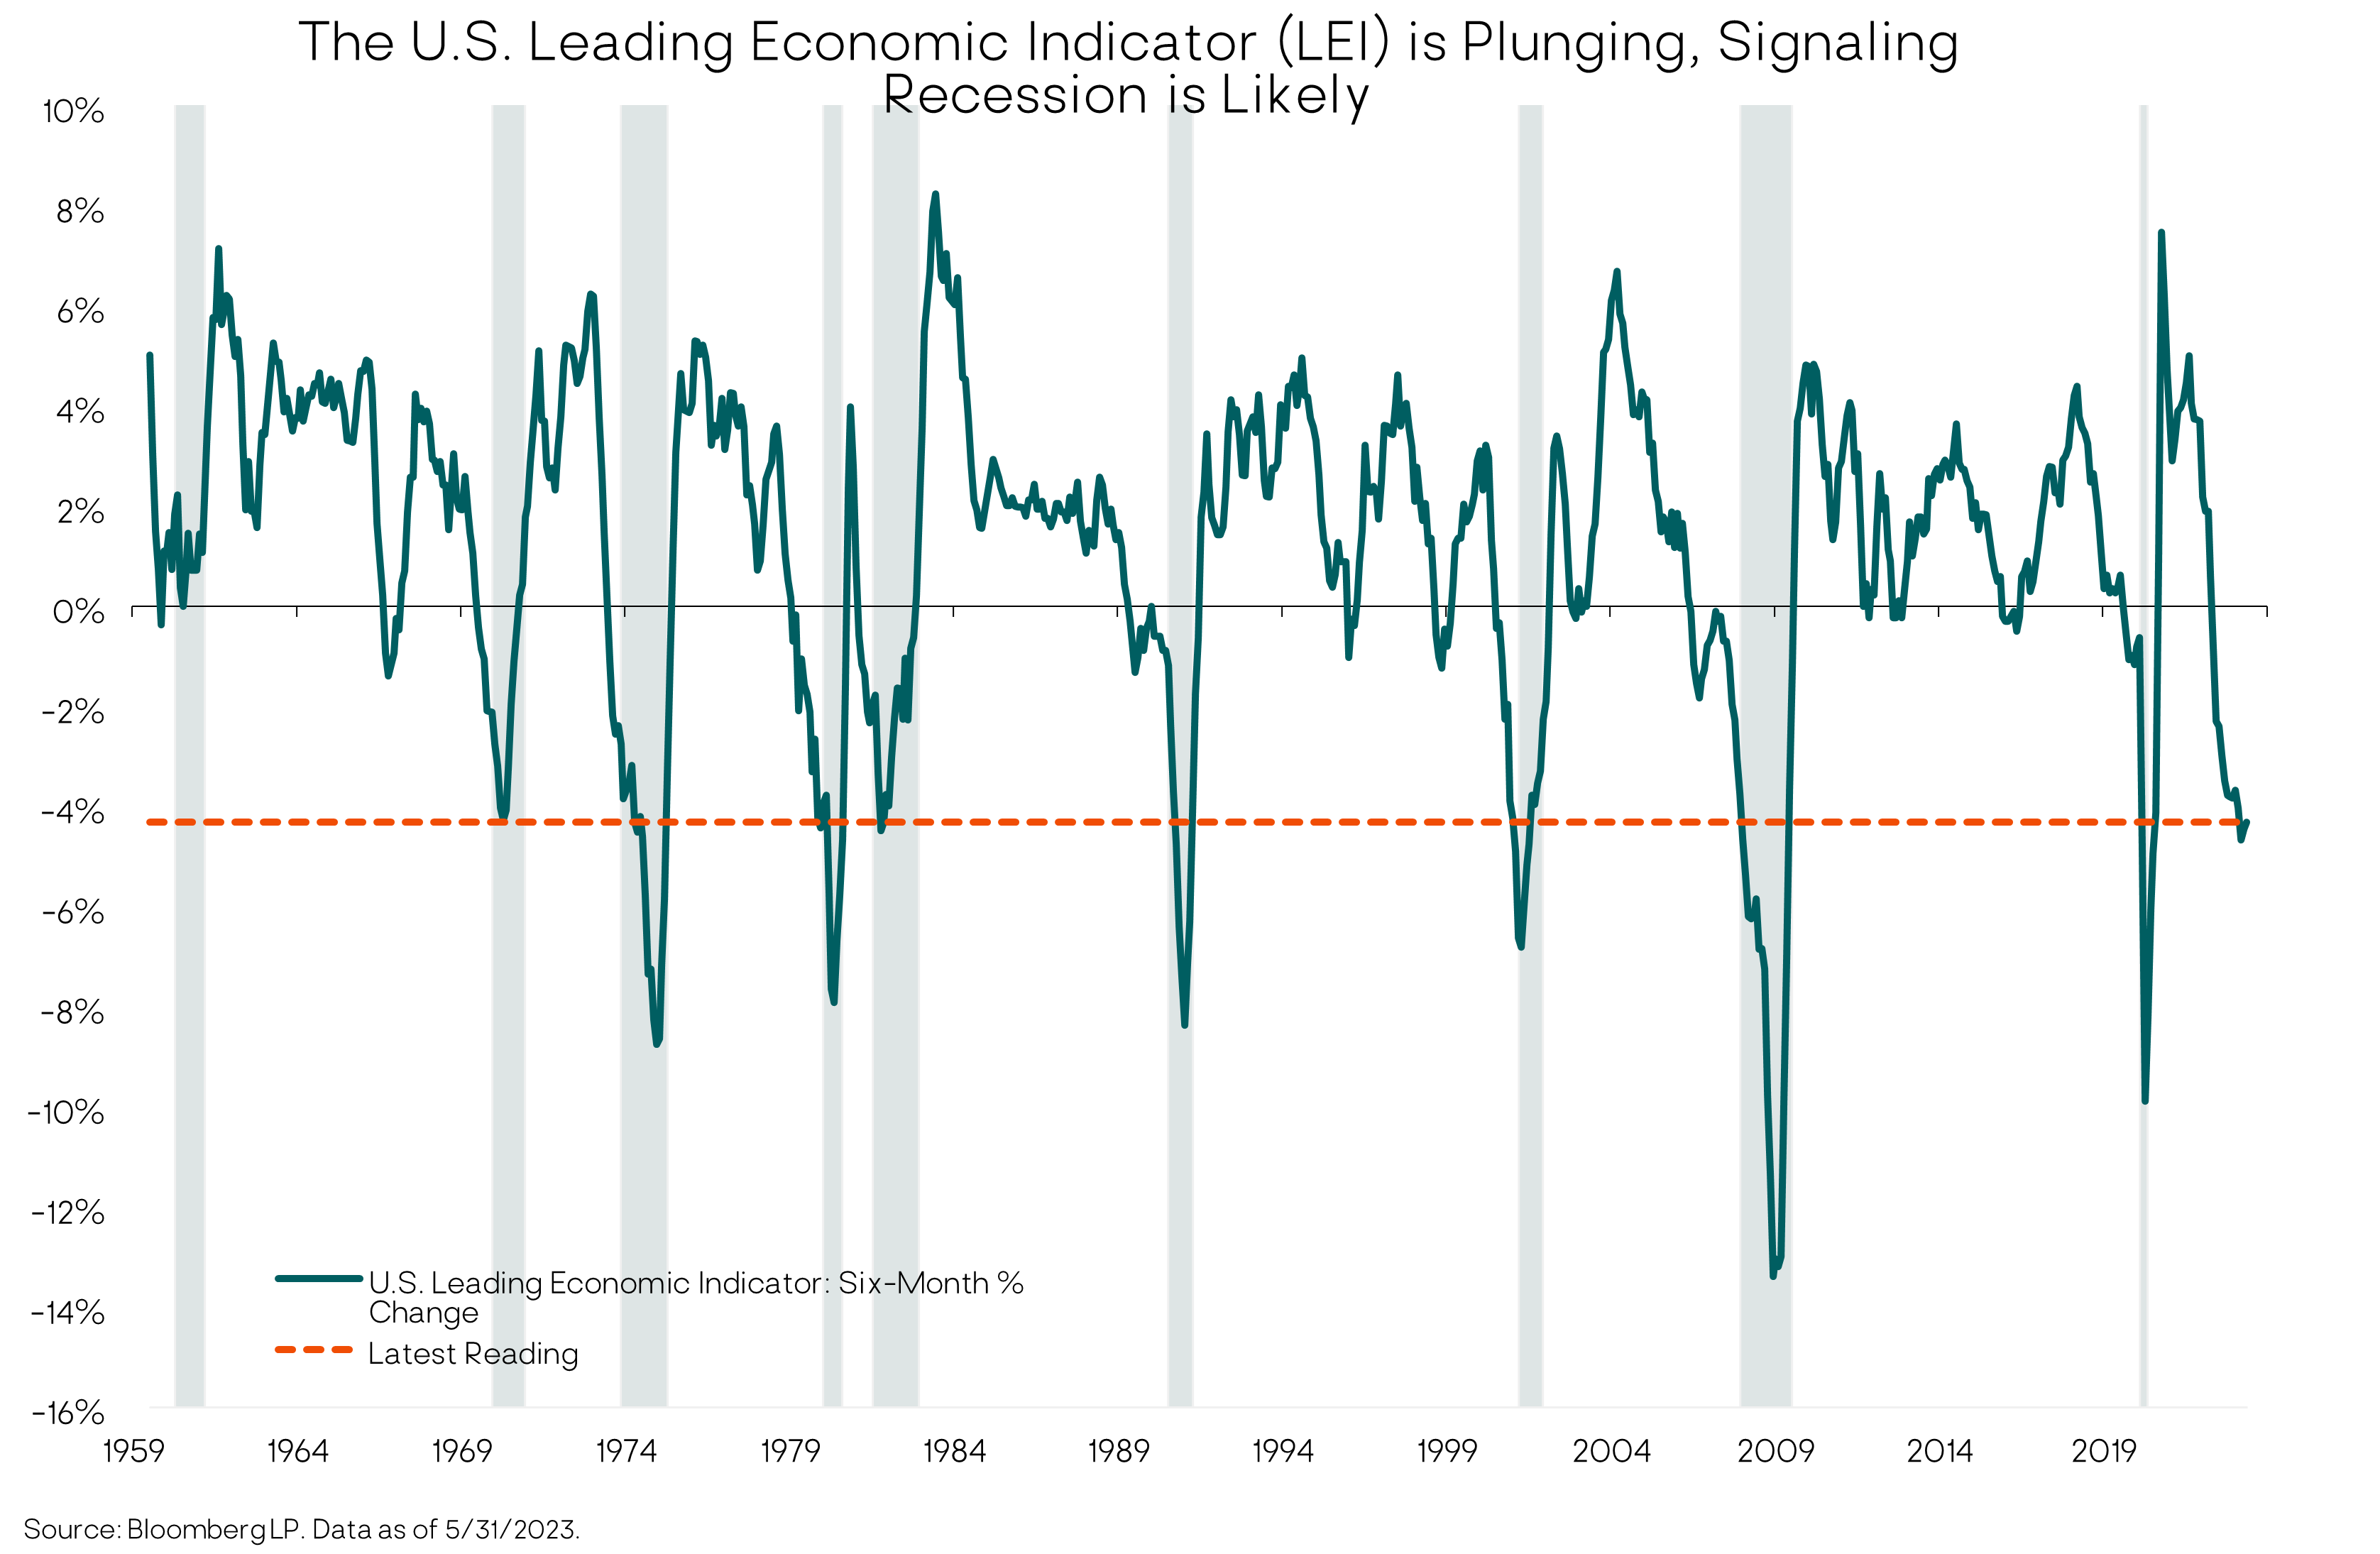
However, the key economic leading indicators that have driven our base case U.S. recession expectation have shown no sign of improvement over the past quarter. In addition, we do not think the Fed is close to loosening monetary policy any time soon, barring a recession. And the full, lagged, economic effects of the Fed’s aggressive monetary policy tightening have not yet played out.
Therefore, we believe the odds still favor a recession within the next 12 months or so. But as always, given the inherent uncertainty, our investment portfolio positioning incorporates a wide range of potential macro/market outcomes, rather than betting heavily on a single scenario.
Revisiting our key leading indicators, the Conference Board Leading Economic Index (LEI) has declined for 14 straight months, the longest negative streak since the 2008 financial crisis, and its six-month rate of change is deeply in recessionary territory.
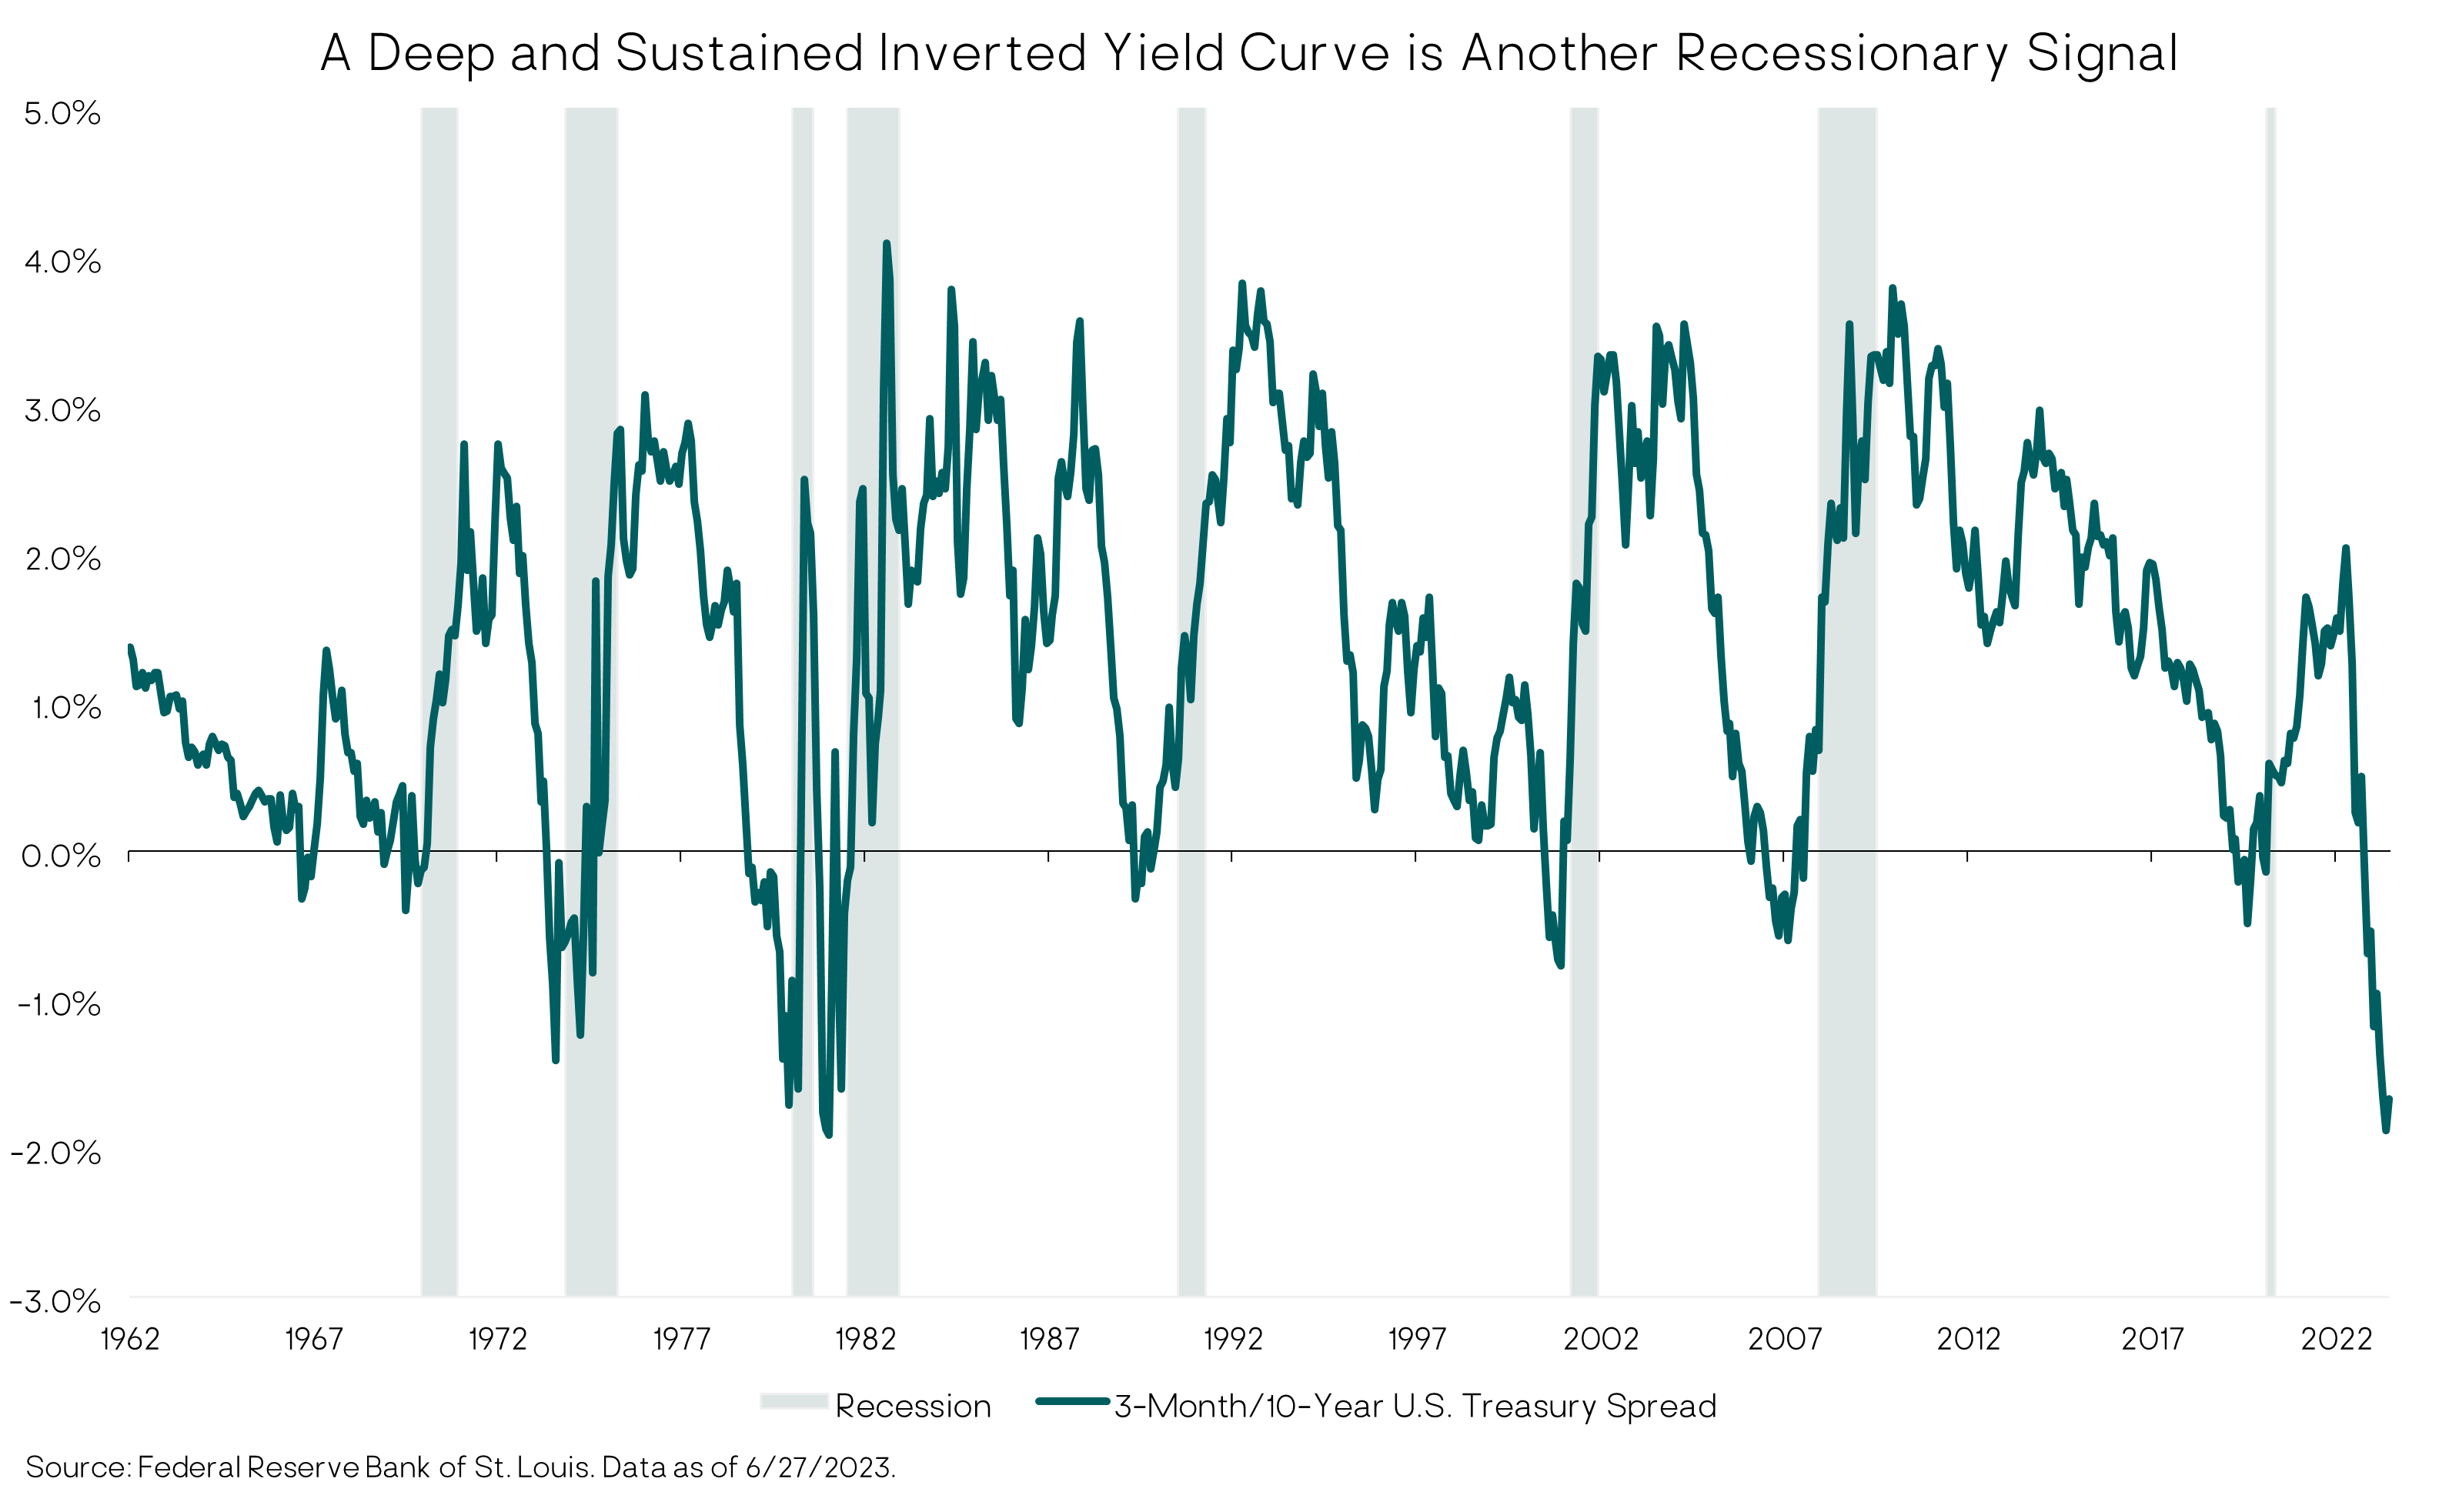
The second key recession indicator is the inverted Treasury yield curve – meaning short-term Treasury yields are above longer-term Treasury bond yields. An inverted yield curve is usually (but not always) a leading indicator of recession. As with the LEI, the depth and duration of the current inversion has never occurred without a subsequent recession in the U.S.
However, the timing from initial curve inversion to the onset of recession has been highly variable. According to BCA Research, across the eight U.S. recessions dating back to 1969, the average lead time from the initial yield curve inversion to the onset of recession has been 11.3 months; but it has varied from 5 months to 16 months (using the 10-year/3-month yield curve). The current inversion started in November 2022, so a second half 2023/early 2024 recession would be in line with the historical range.
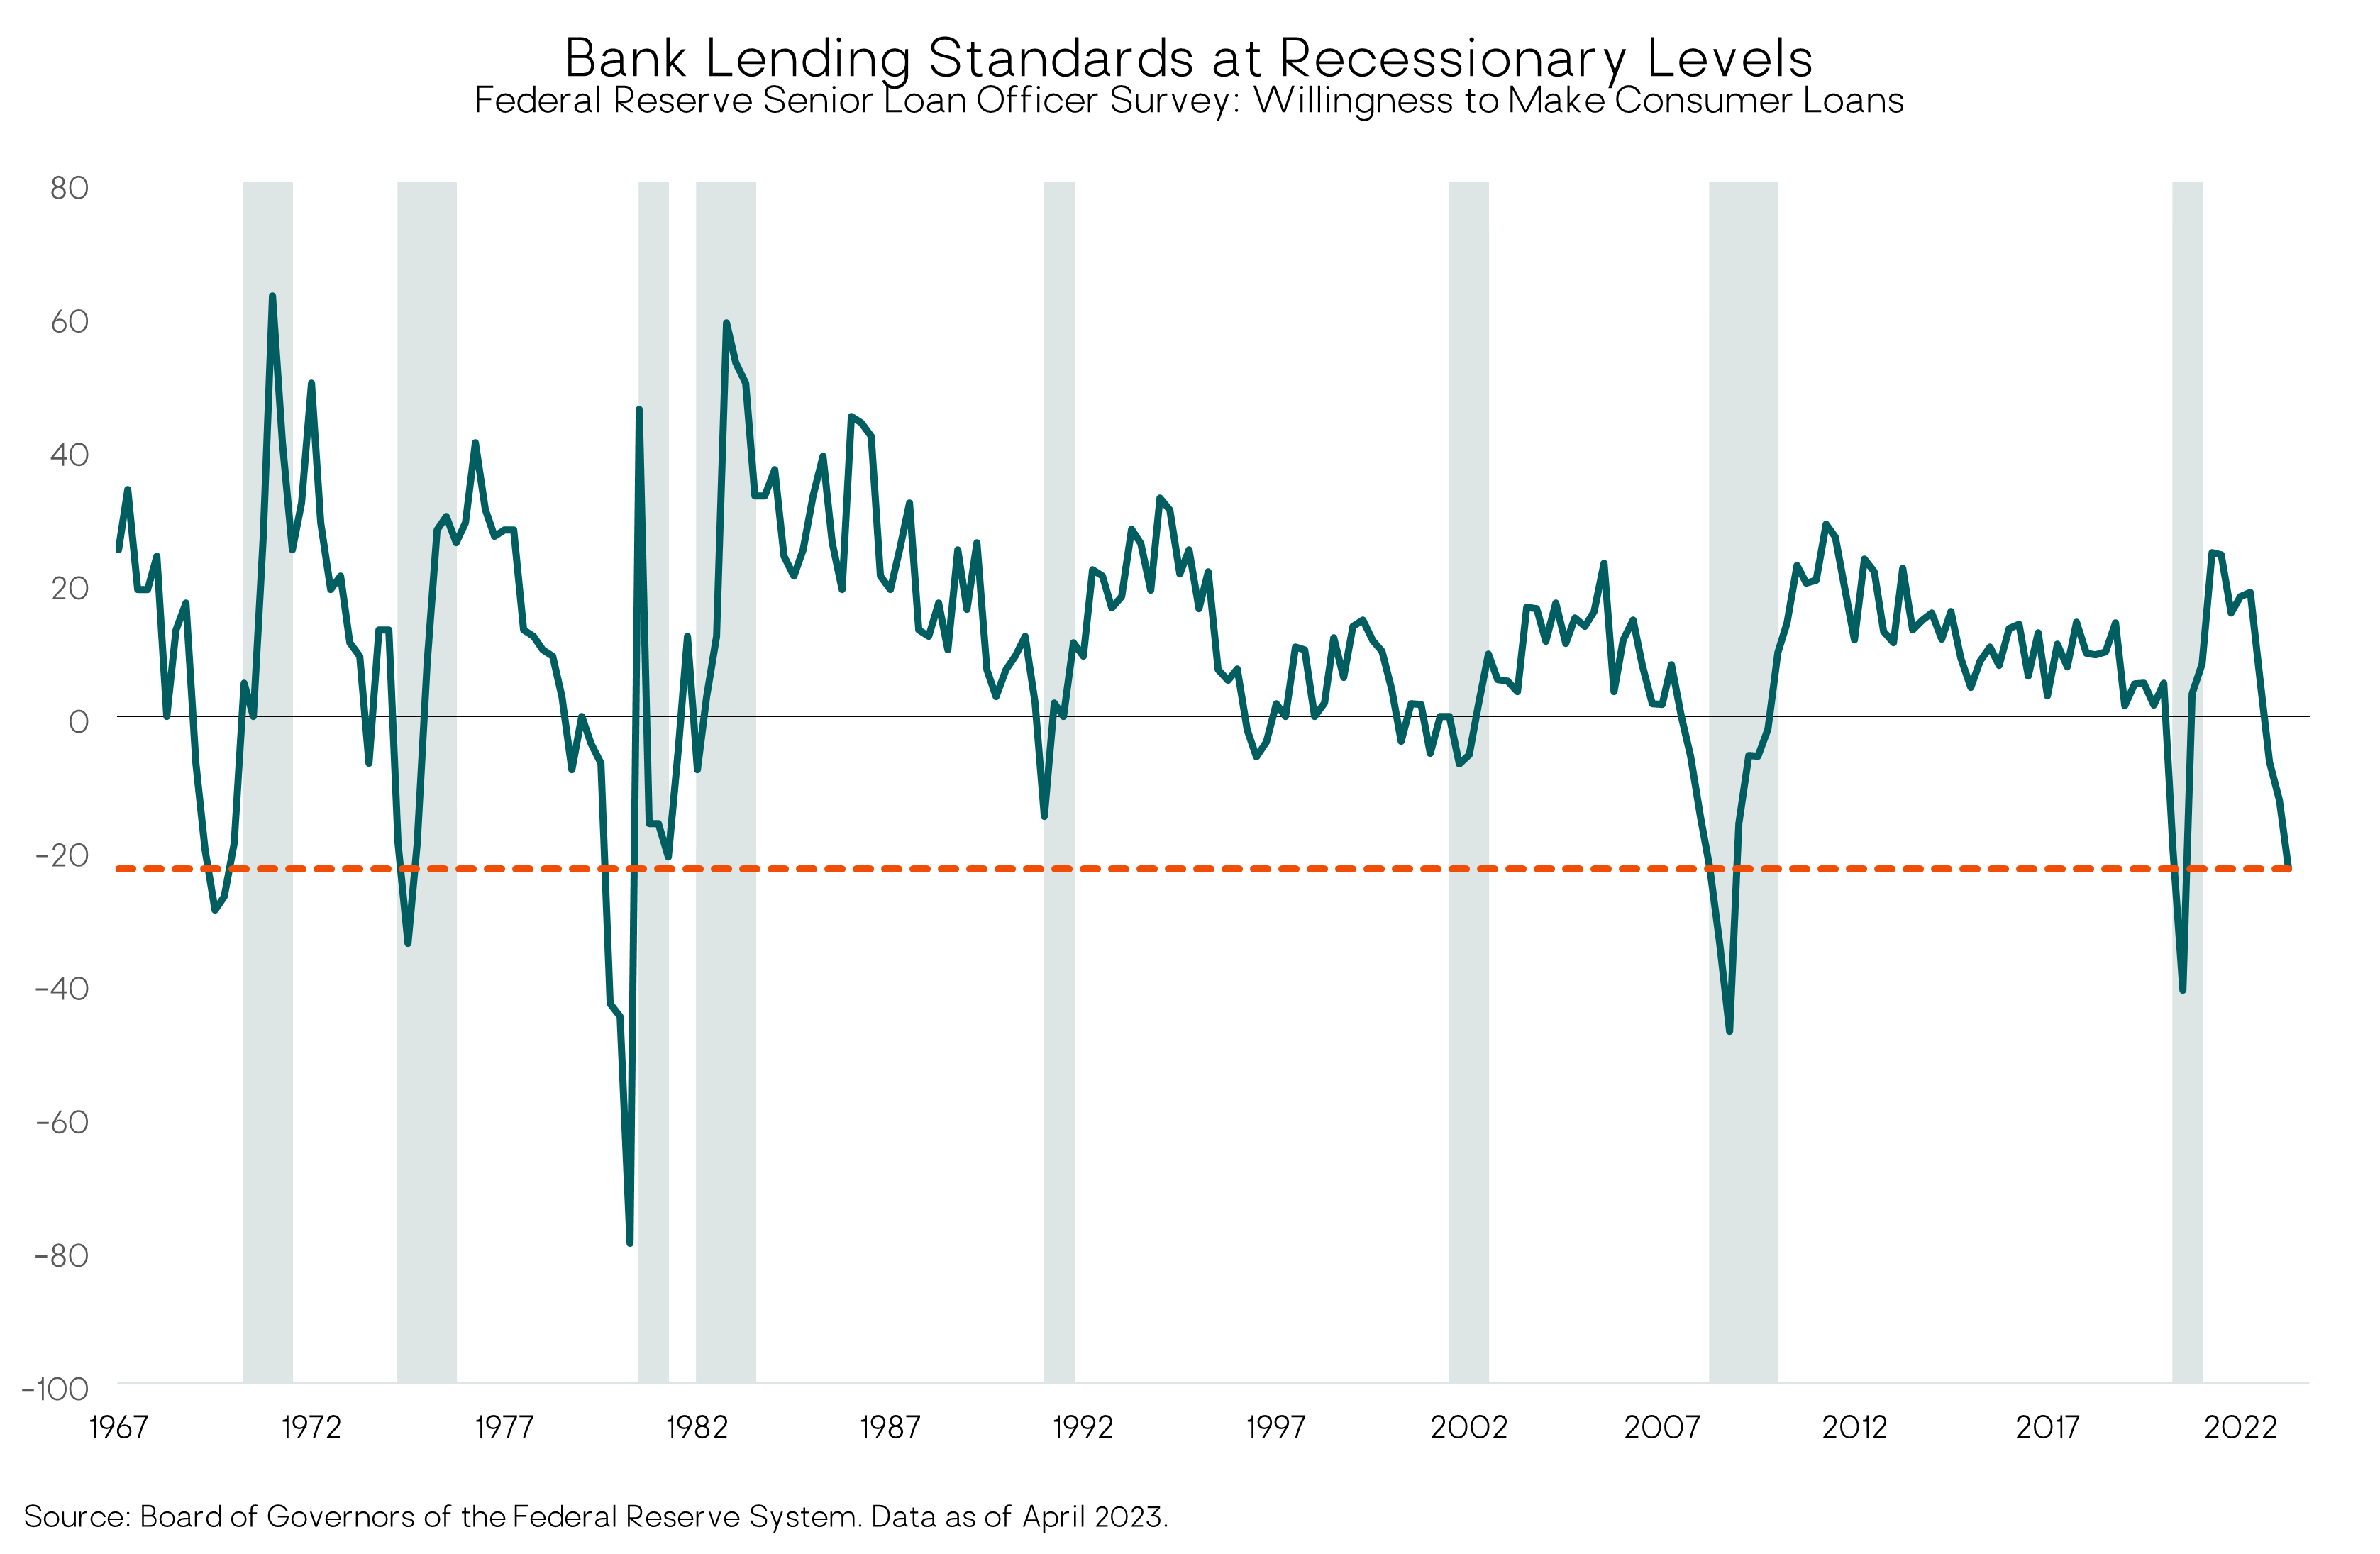
Bank lending standards are another economic leading indicator. Lending standards impact overall credit conditions, which in turn impact economic growth via consumer and business borrowing and spending. Thankfully, the worse-case scenarios swirling during the regional banking turmoil in March have not come to pass. (We were not expecting the worst case given the Fed/FDIC’s quick responses.) However, lending conditions remain tight and at levels consistent with recession in the past. And at this late stage in the economic cycle, credit conditions are likely to tighten further. This will further weigh on business investment (capital expenditures, or CAPEX) and consumer spending.
Macro bottom line
A U.S. recession within the next six to 12 months is not a certainty. But weighing the evidence as we see it, we believe recession is still the most likely outcome.
Financial Markets Outlook and Portfolio Positioning
Equity markets
Just as the U.S. economy has been more resilient than expected in the face of aggressive Fed tightening this year, the S&P 500 stock index has been as well — and then some — gaining nearly 17%.
There are always multiple factors driving the markets, but we think key drivers of this year’s market strength include the following: (1) the economy has held up better than expected, reducing investor fears of an earnings recession; (2) corporate earnings, in aggregate, have come in better than expected; (3) market sentiment (a contrarian indicator) entered the year very pessimistic, creating opportunity for money to flow back into stocks as pessimism turned to optimism; (4) with inflation dropping, markets are optimistic the Fed will end its tightening; (5) the regional bank crisis in March subsided with no obvious systemic damage; (6) the debt-ceiling circus left town (until 2025); and, (7) AI euphoria has super-charged a handful of mega-cap growth stocks, driving the overall market index sharply higher (i.e., it’s been a very narrow market advance).
AI mania?
As to the last factor, we’d make the point that while it is likely AI will have a huge impact on society and the global economy, that doesn’t necessarily mean the current AI stock frenzy is justified by these companies’ underlying earnings fundamentals. It may be in some cases. But we can also remember the tech/internet stock bubble in 1998-2000. The internet obviously has had huge economic impact over the past 25 years, but very few tech stocks were priced appropriately in early 2000.
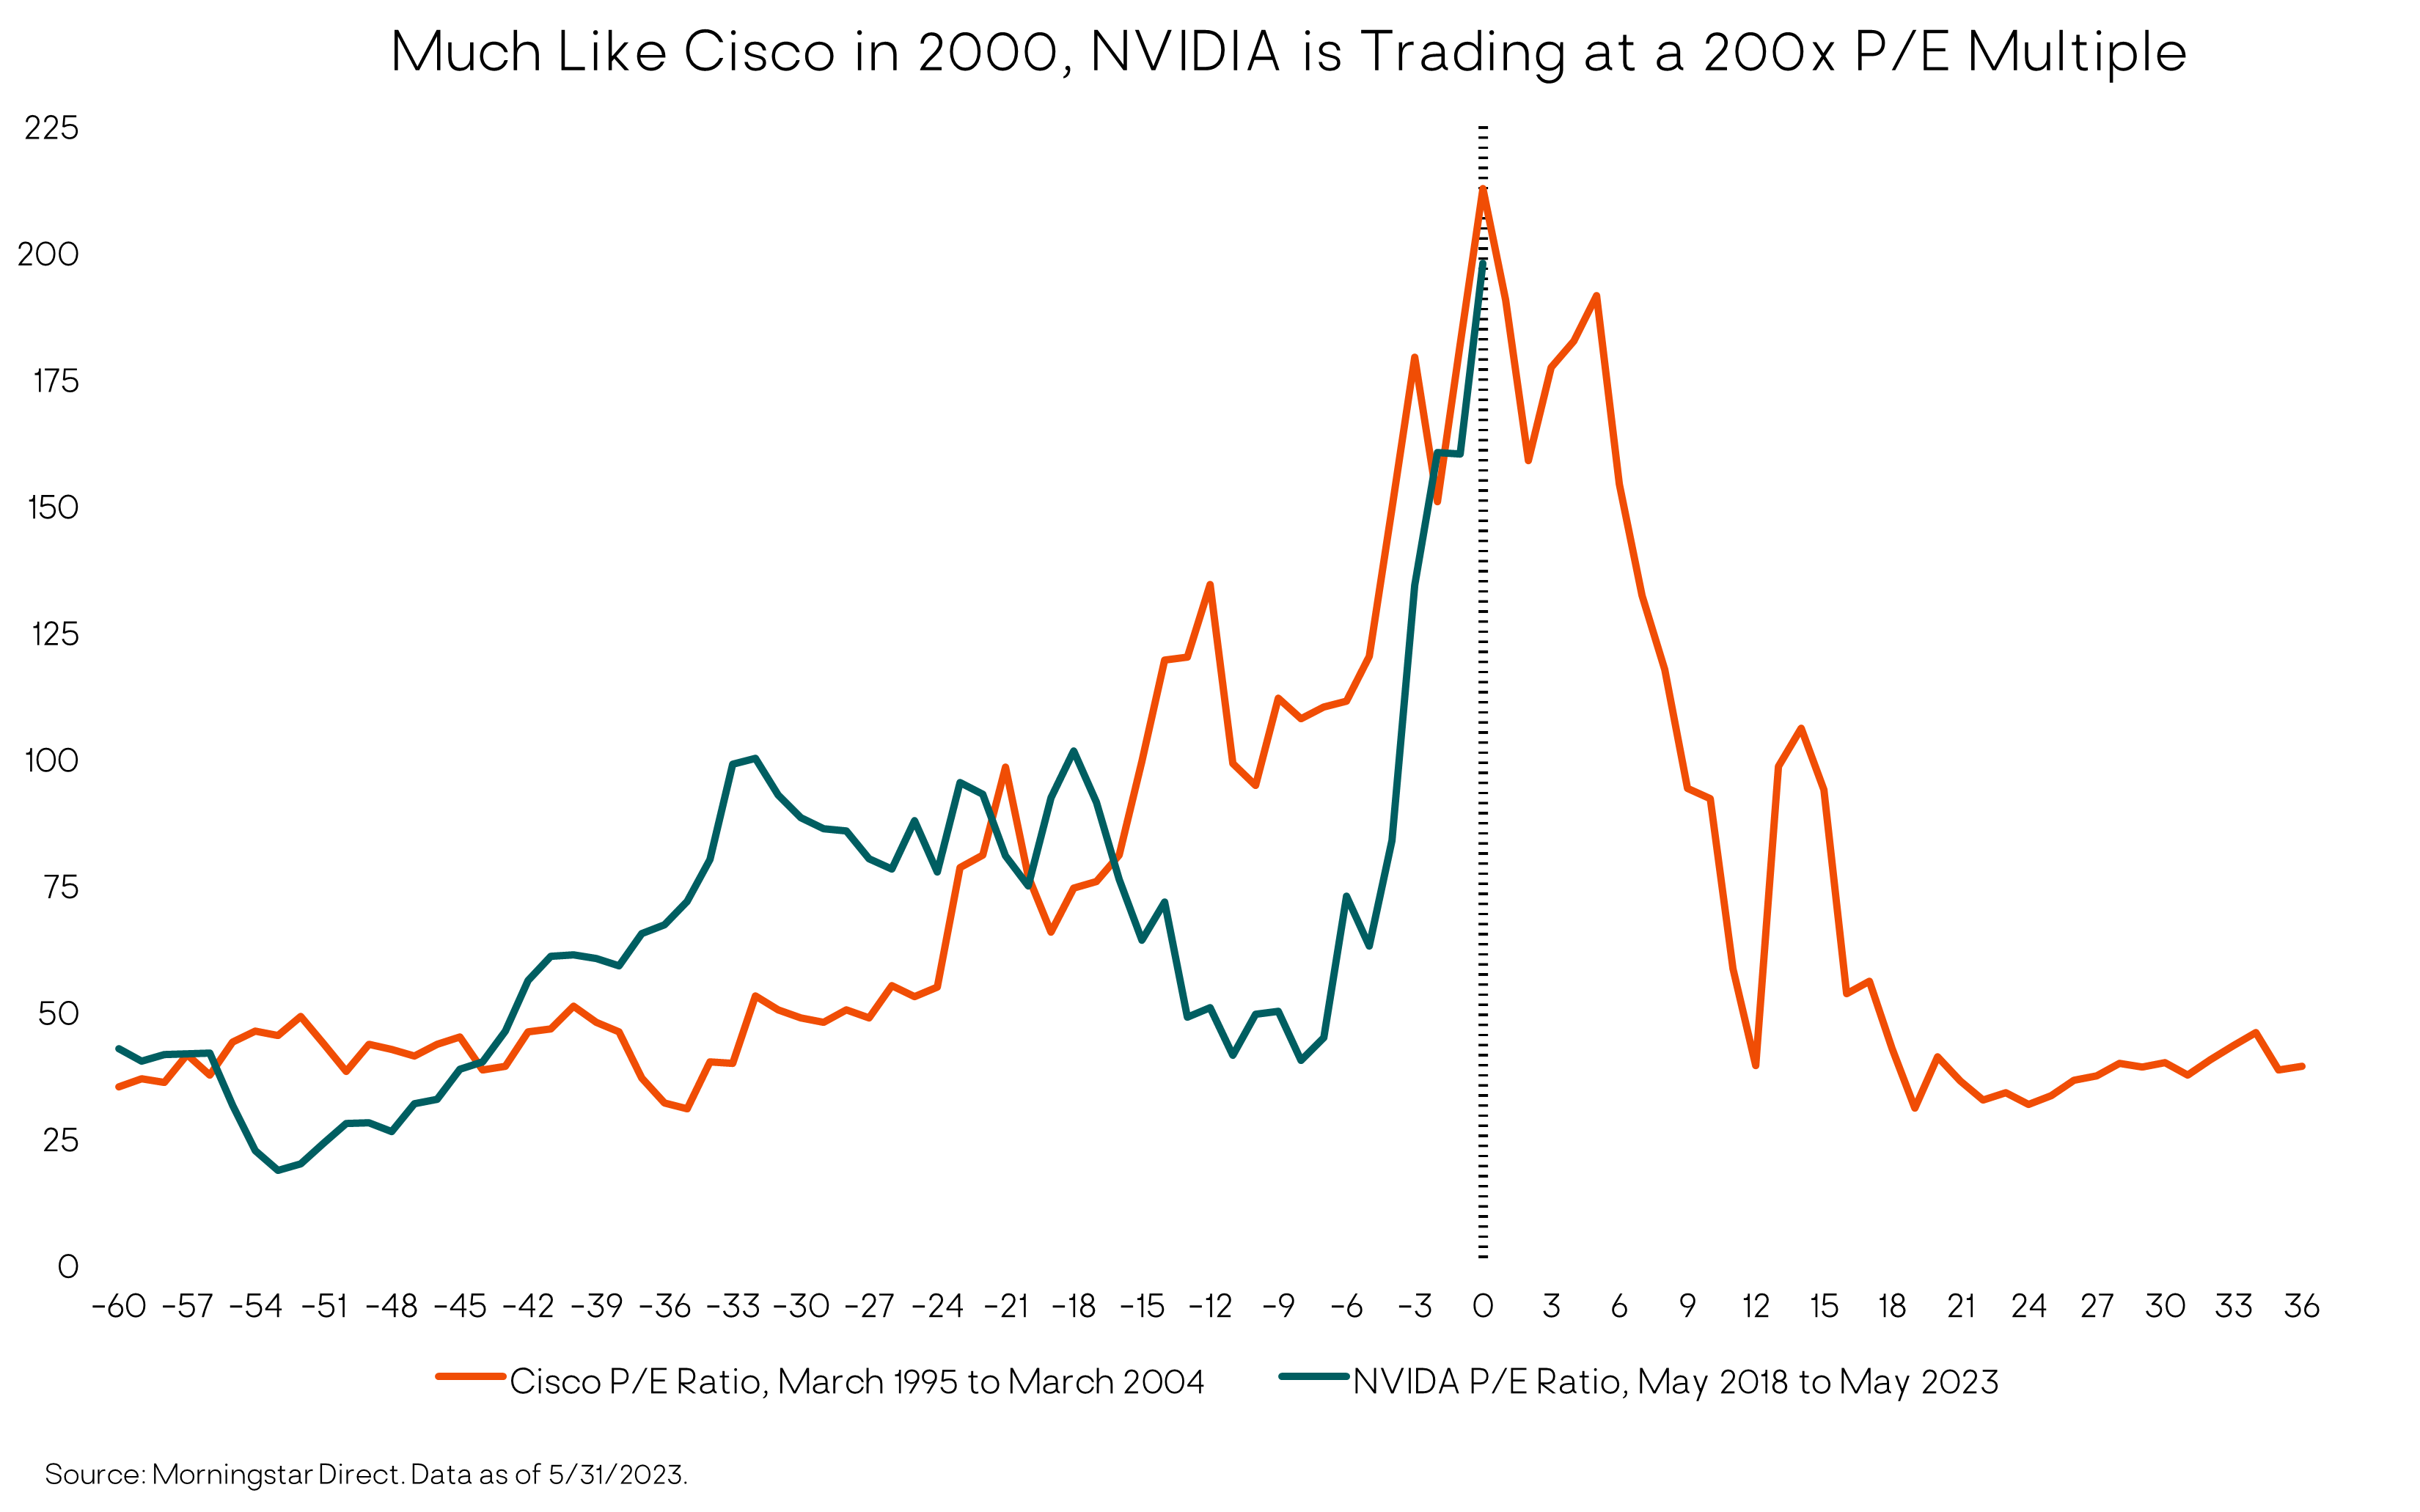
As an example, a poster child for the current AI exuberance is Nvidia, a graphics chip maker used in AI applications. The stock is up over 200% this year (as of 6/30/23), pushing its market cap over $1 trillion and into the top-10 largest constituents of the S&P 500. Nvidia has strong fundamental earnings growth potential, but its stock is currently trading at a P/E ratio of more than 220x! (The overall S&P 500 index has a P/E around 20x, currently.)
We’re not stock-pickers, but this reminds us of Cisco stock’s valuation during the tech bubble. You don’t hear much about Cisco today although it is a $200 billion company. But back then it was a large-cap tech/telecom superstar. It was the third-largest company in the S&P 500 (after Microsoft and GE) and sported a P/E above 200x in early 2000. Cisco’s stock price peaked at $56 (adjusted for subsequent stock splits) in March 2000. Today it is around $52, with a P/E around 18x. That’s a 23-year return of less than 0% – although we doubt anyone who bought Cisco at $56 held on during its gut-wrenching 90% decline to October 2002.
The lesson: Buyer beware of mega-cap stocks with triple-digit P/Es!
Will History Repeat (or At Least Rhyme)?
Corporate earnings and valuations ultimately drive equity returns
Although the markets can be driven by investor sentiment and momentum in the shorter-term, ultimately it is corporate earnings – “fundamentals” – and the price one pays for those earnings that drive stock prices and investor returns over the medium to longer term.
Our assessment, as well as that of many investment strategists we respect, continues to be that consensus/analyst earnings expectations for the remainder of 2023 are too high given the likelihood of an economic recession. Put differently: We do not believe the S&P 500 at current levels is adequately pricing in the likelihood and magnitude of a near-term earnings recession.
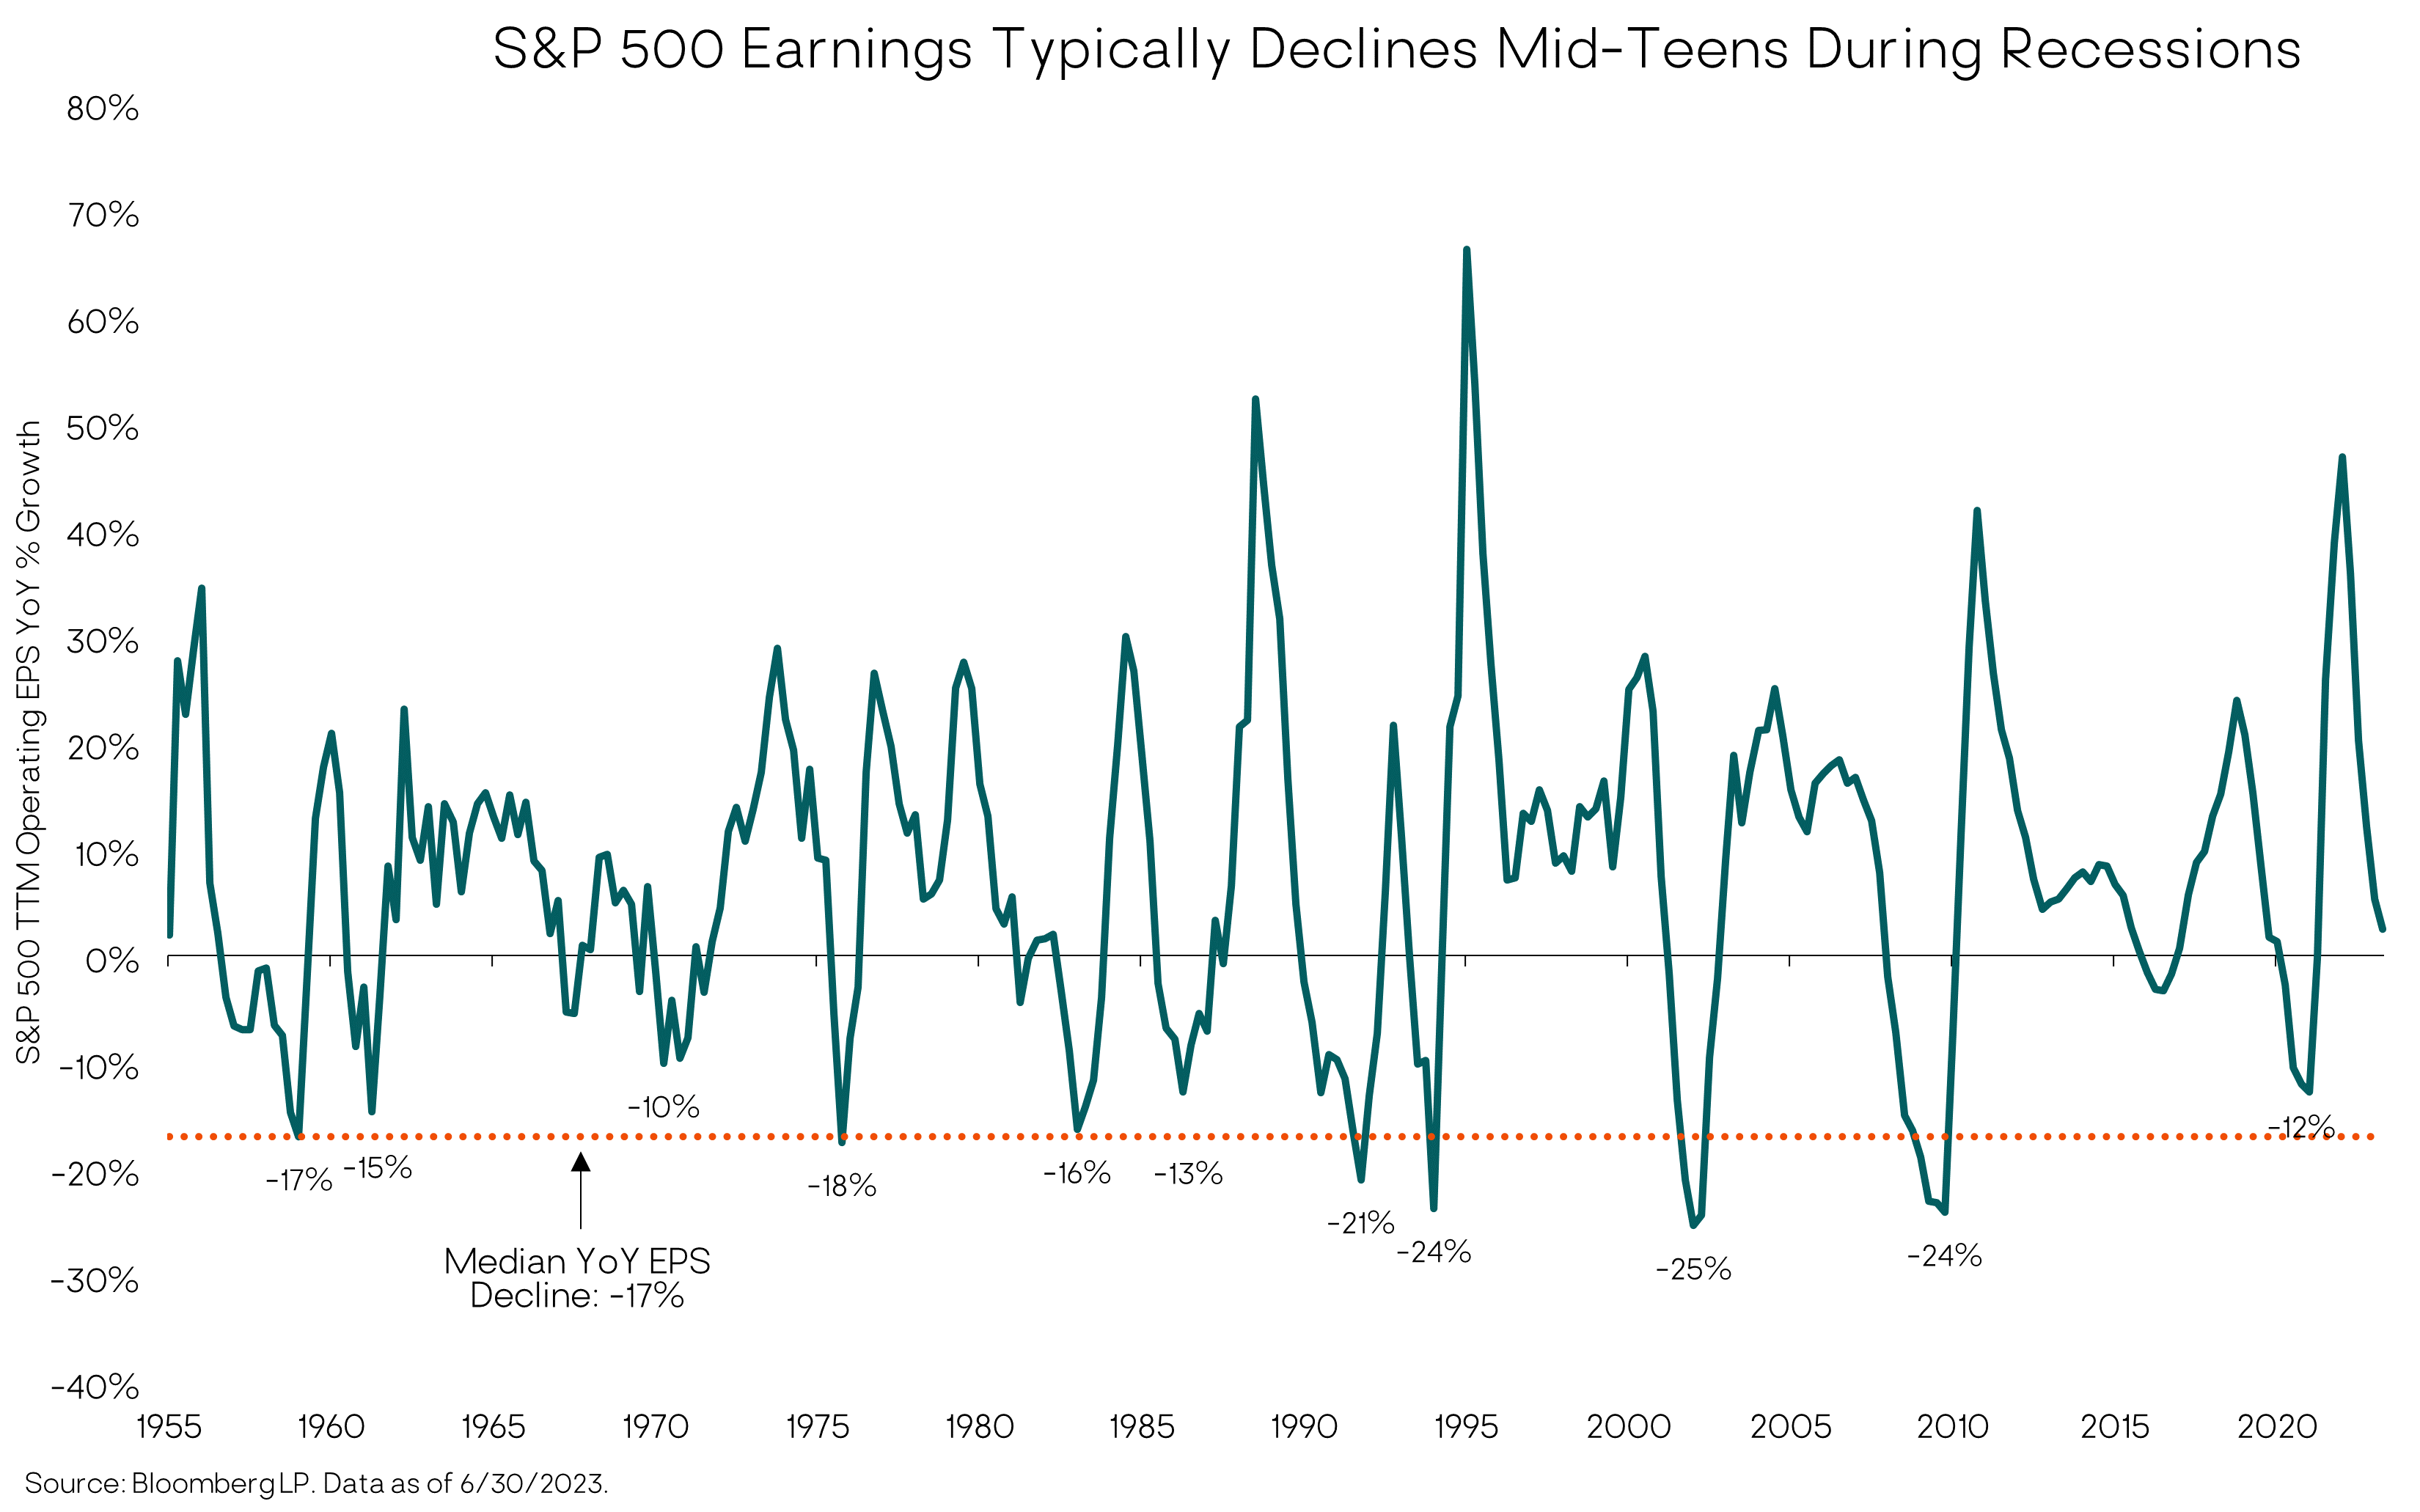
An economic recession implies a corporate earnings recession as profit margins compress and sales growth slows. In fact, it is the compression in profits that typically lead companies to lay off workers, which further exacerbates the recessionary impulse from shrinking demand for goods and services.
Even if this recession is relatively mild, earnings are likely to decline at least 10%. (The average historical earnings recession is negative 15-20%.) In contrast, the current consensus earnings forecast is for a slight increase in earnings through year-end, followed by double-digit growth in 2024; and analysts have recently been revising upward their earnings growth expectations. This is inconsistent with a recessionary scenario, in our view.
If and when actual earnings fail to meet expectations, we estimate the potential downside for the S&P 500 to be on order of 20-30% from current levels before the market cycle bottoms and the next bull market and economic recovery begin.
As a reminder, every U.S. bear market associated with a recession has bottomed during the recession – on average several months after the recession has started. Again, there is wide dispersion historically in terms of the exact timing, but in no cases did the S&P 500 hit its cyclical low prior to the onset of recession. On the positive side, the market typically starts recovering before the recession clearly ends – once all the bad news (and then some) is fully priced in and investors start anticipating the next up cycle.
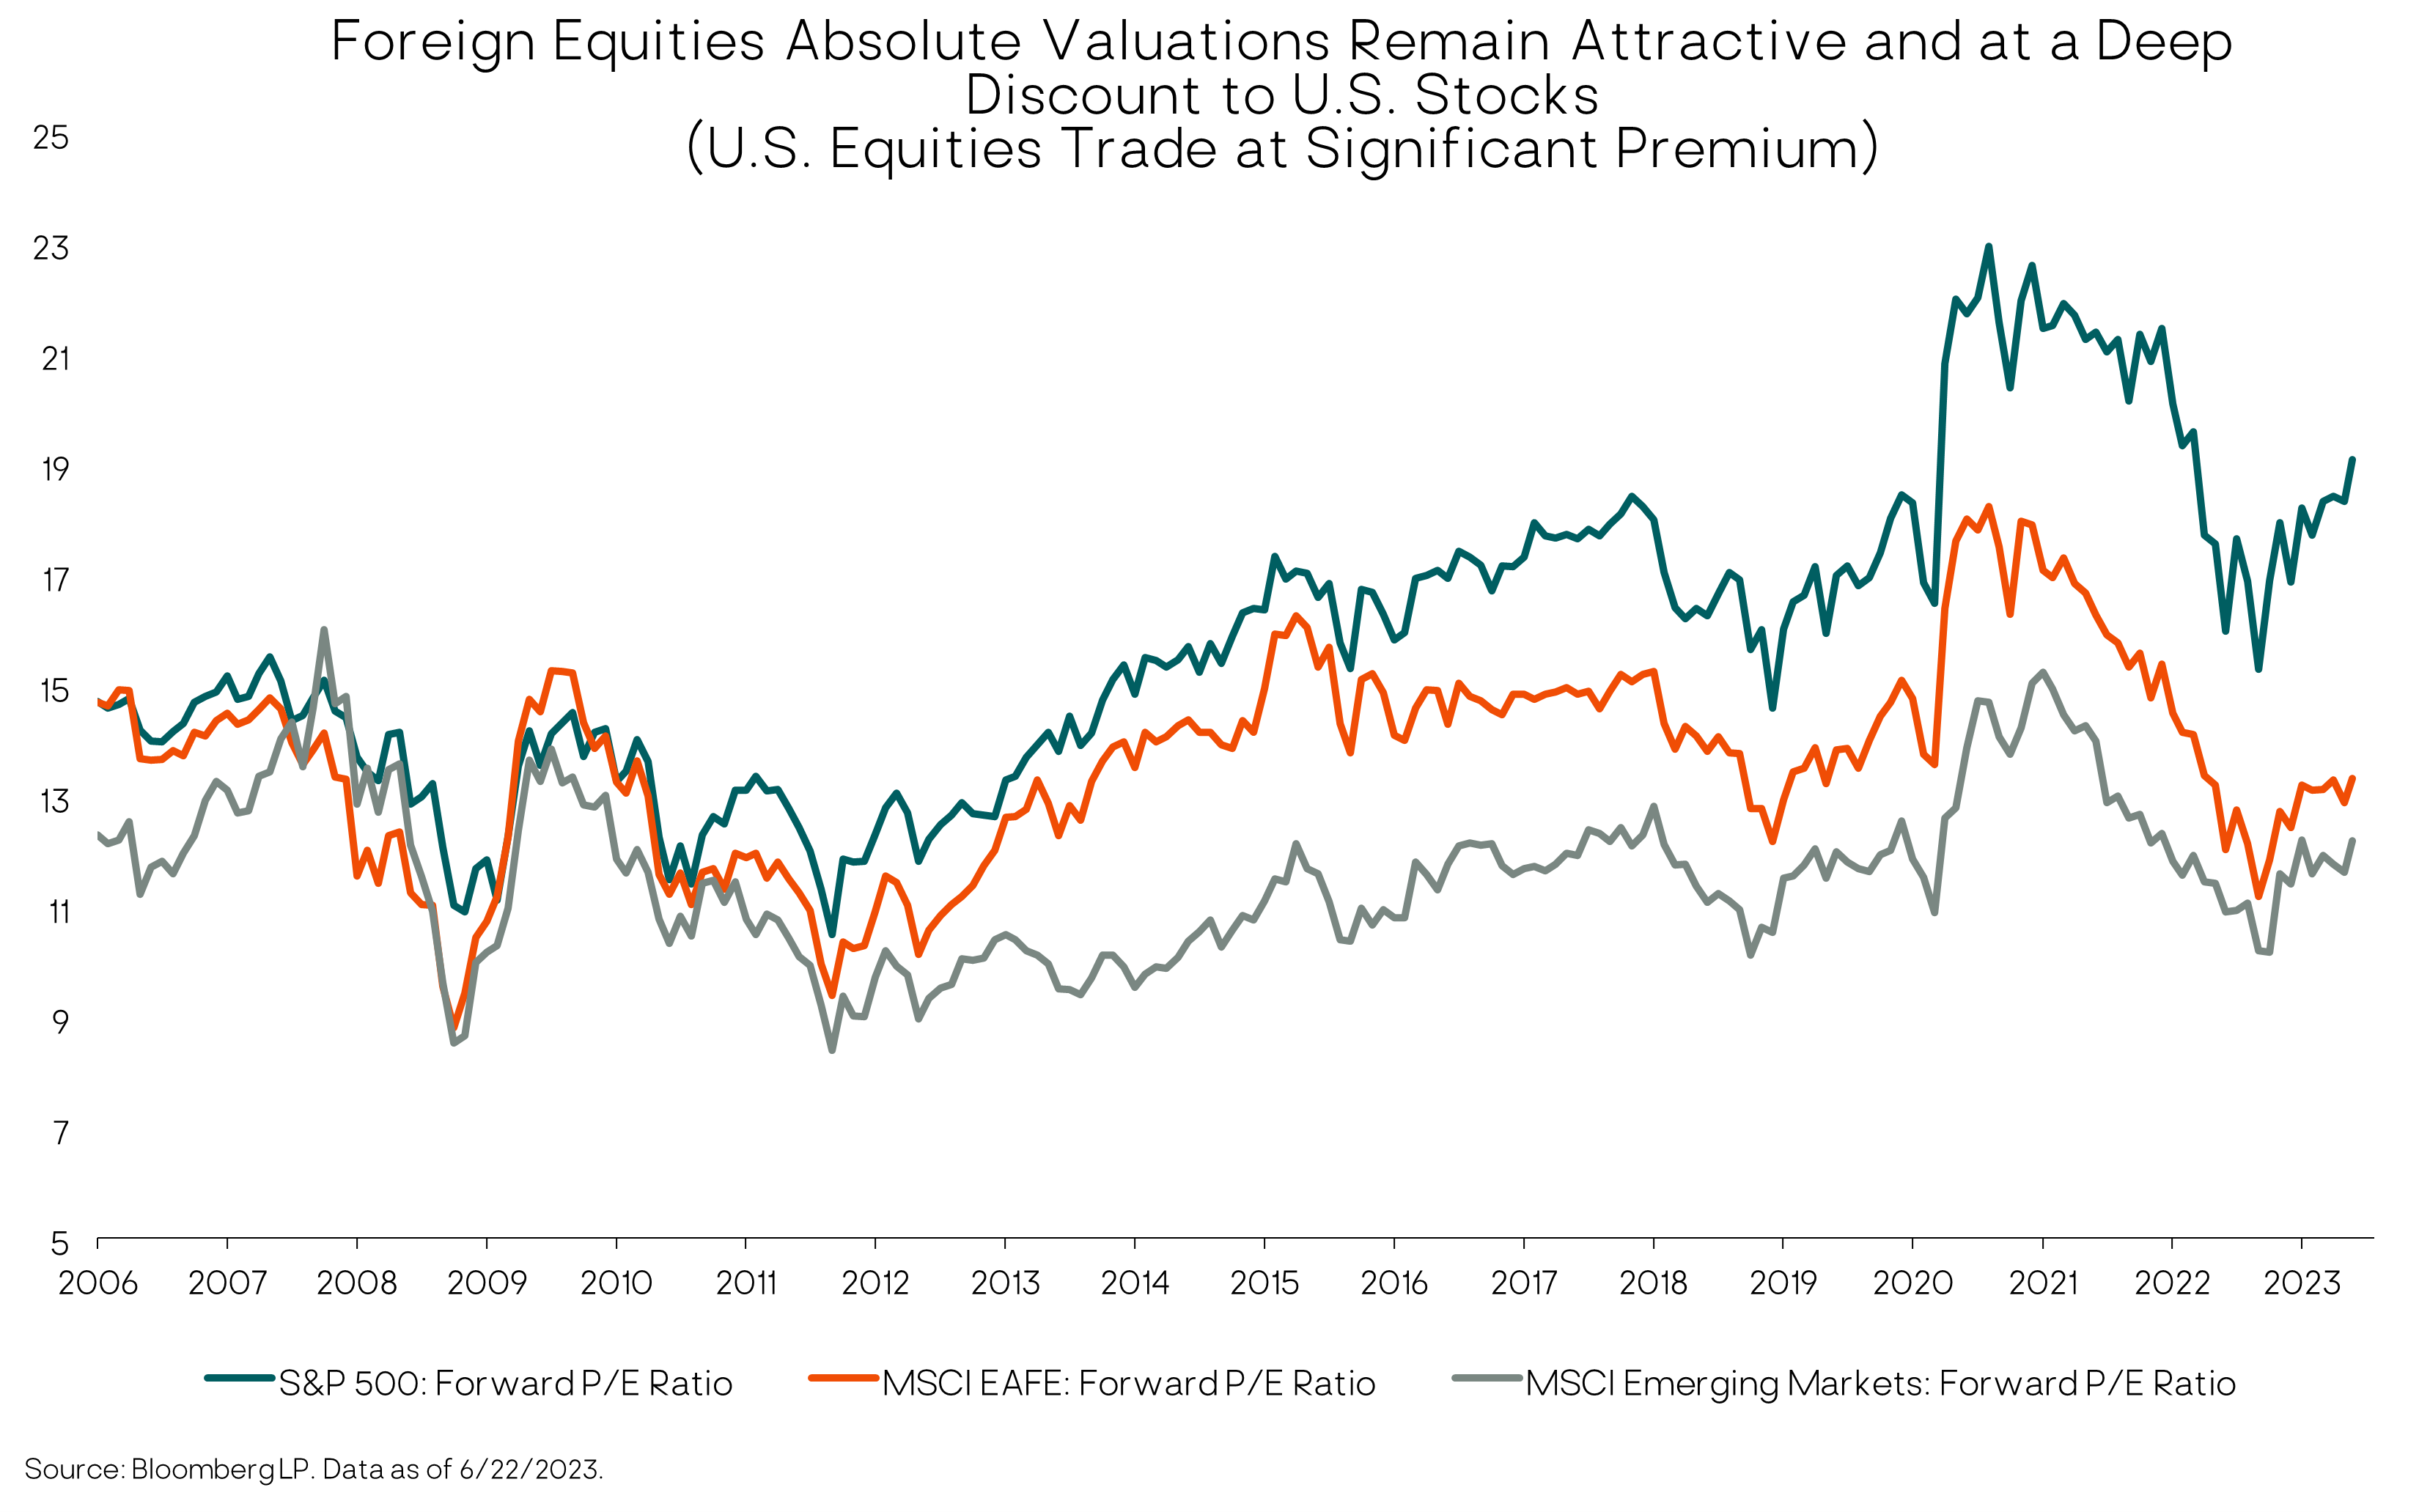
International and EM stocks
In our base case recession scenario, we’d also expect developed international and EM equity markets to fall – probably around the same percentage as the U.S. market. Although foreign markets are much less expensive than the U.S. market – reflecting low earnings expectations and depressed sentiment – that probably won’t do much to prevent short-term fear from pushing all global equity markets lower. In addition, the dollar would likely strengthen as it is a “flight-to-safety” currency, which would have an added negative impact on foreign equity returns for dollar-based investors.
However, while we maintain a slight underweight to global equities overall, we continue to tactically favor EM and international stocks relative to the U.S. based on their higher expected returns over our medium-term (five-year) horizon. Our updated base case economic scenario five-year expected return estimates for developed international and emerging markets (EM) equities are high-single to low-double digit annual average returns, while we estimate low- to mid-single digit returns for the S&P 500. This is below our long-term “strategic” expected return for the S&P 500, in the mid- to upper-single digits. We don’t think we are being adequately compensated (in terms of expected return) for U.S. stocks’ inherent risks.
As of 6/30/23
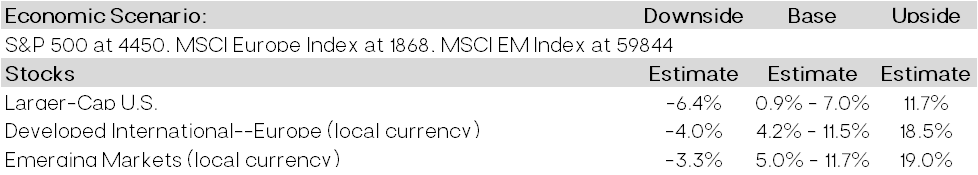
Estimated returns are annualized and generated by iMGPFM. This table shows our five-year, annualized asset class return estimates across several broad macroeconomic scenarios we believe are possible. Collectively, the scenarios encompass the range of outcomes we believe are reasonably possible and therefore worth considering in creating our portfolio allocations. We make assumptions for various fundamental and valuation metrics we believe are consistent for each asset class within each macro scenario then incorporate current prices to generate an estimated return. The macroeconomic scenarios and estimated returns can change. When this happens, we will clearly note it and give guidance on new estimates. See “Estimated Returns Disclosure” at the end of this commentary for more information on macro scenarios and fundamental/valuation metrics used in the analysis.
When the U.S. stock market declines to levels that offer more compelling medium-term returns and adequately discount shorter-term risks, we will look to add back exposure by selling more-defensive assets (e.g., bonds). This almost always happens during a recession when investor pessimism and fear are widespread. Stocks bottom out as value investors start to scoop up bargains, and then continue to rebound as other investors anticipate an economic and earnings recovery, kicking in a positive self-reinforcing cycle.
Fixed Income/Bonds
Unlike U.S. equities, our view of the U.S. fixed income markets – looking more broadly than just core bonds – is positive. With rising yields over the past year, most bond market sectors now offer attractive expected returns relative to their risk.
For example, the yield on the core U.S. Aggregate Bond Index is currently around 4.7%. With inflation very likely to drop below 4%, core bonds are finally providing a positive real (after-inflation) yield. With a duration of around 6 years, the core bond index will also generate strong price gains if interest rates fall during a recession, as we’d expect.
In addition to our core bond exposure, we continue to have a meaningful allocation to higher-yielding, actively managed, flexible bond funds run by experienced teams with broad investment opportunity sets. There are many fixed-income sectors outside of traditional core bonds that offer attractive risk-return potential, and we want to access them via these active managers. These funds are currently yielding in the high single-digits. While the higher yield indicates they carry more credit risk than core bonds, the active bond managers we use are very attuned to risk management, especially heading into a late-cycle/recessionary period. And they have the flexibility to tactically vary their portfolio exposures in response to market risks and return opportunities.
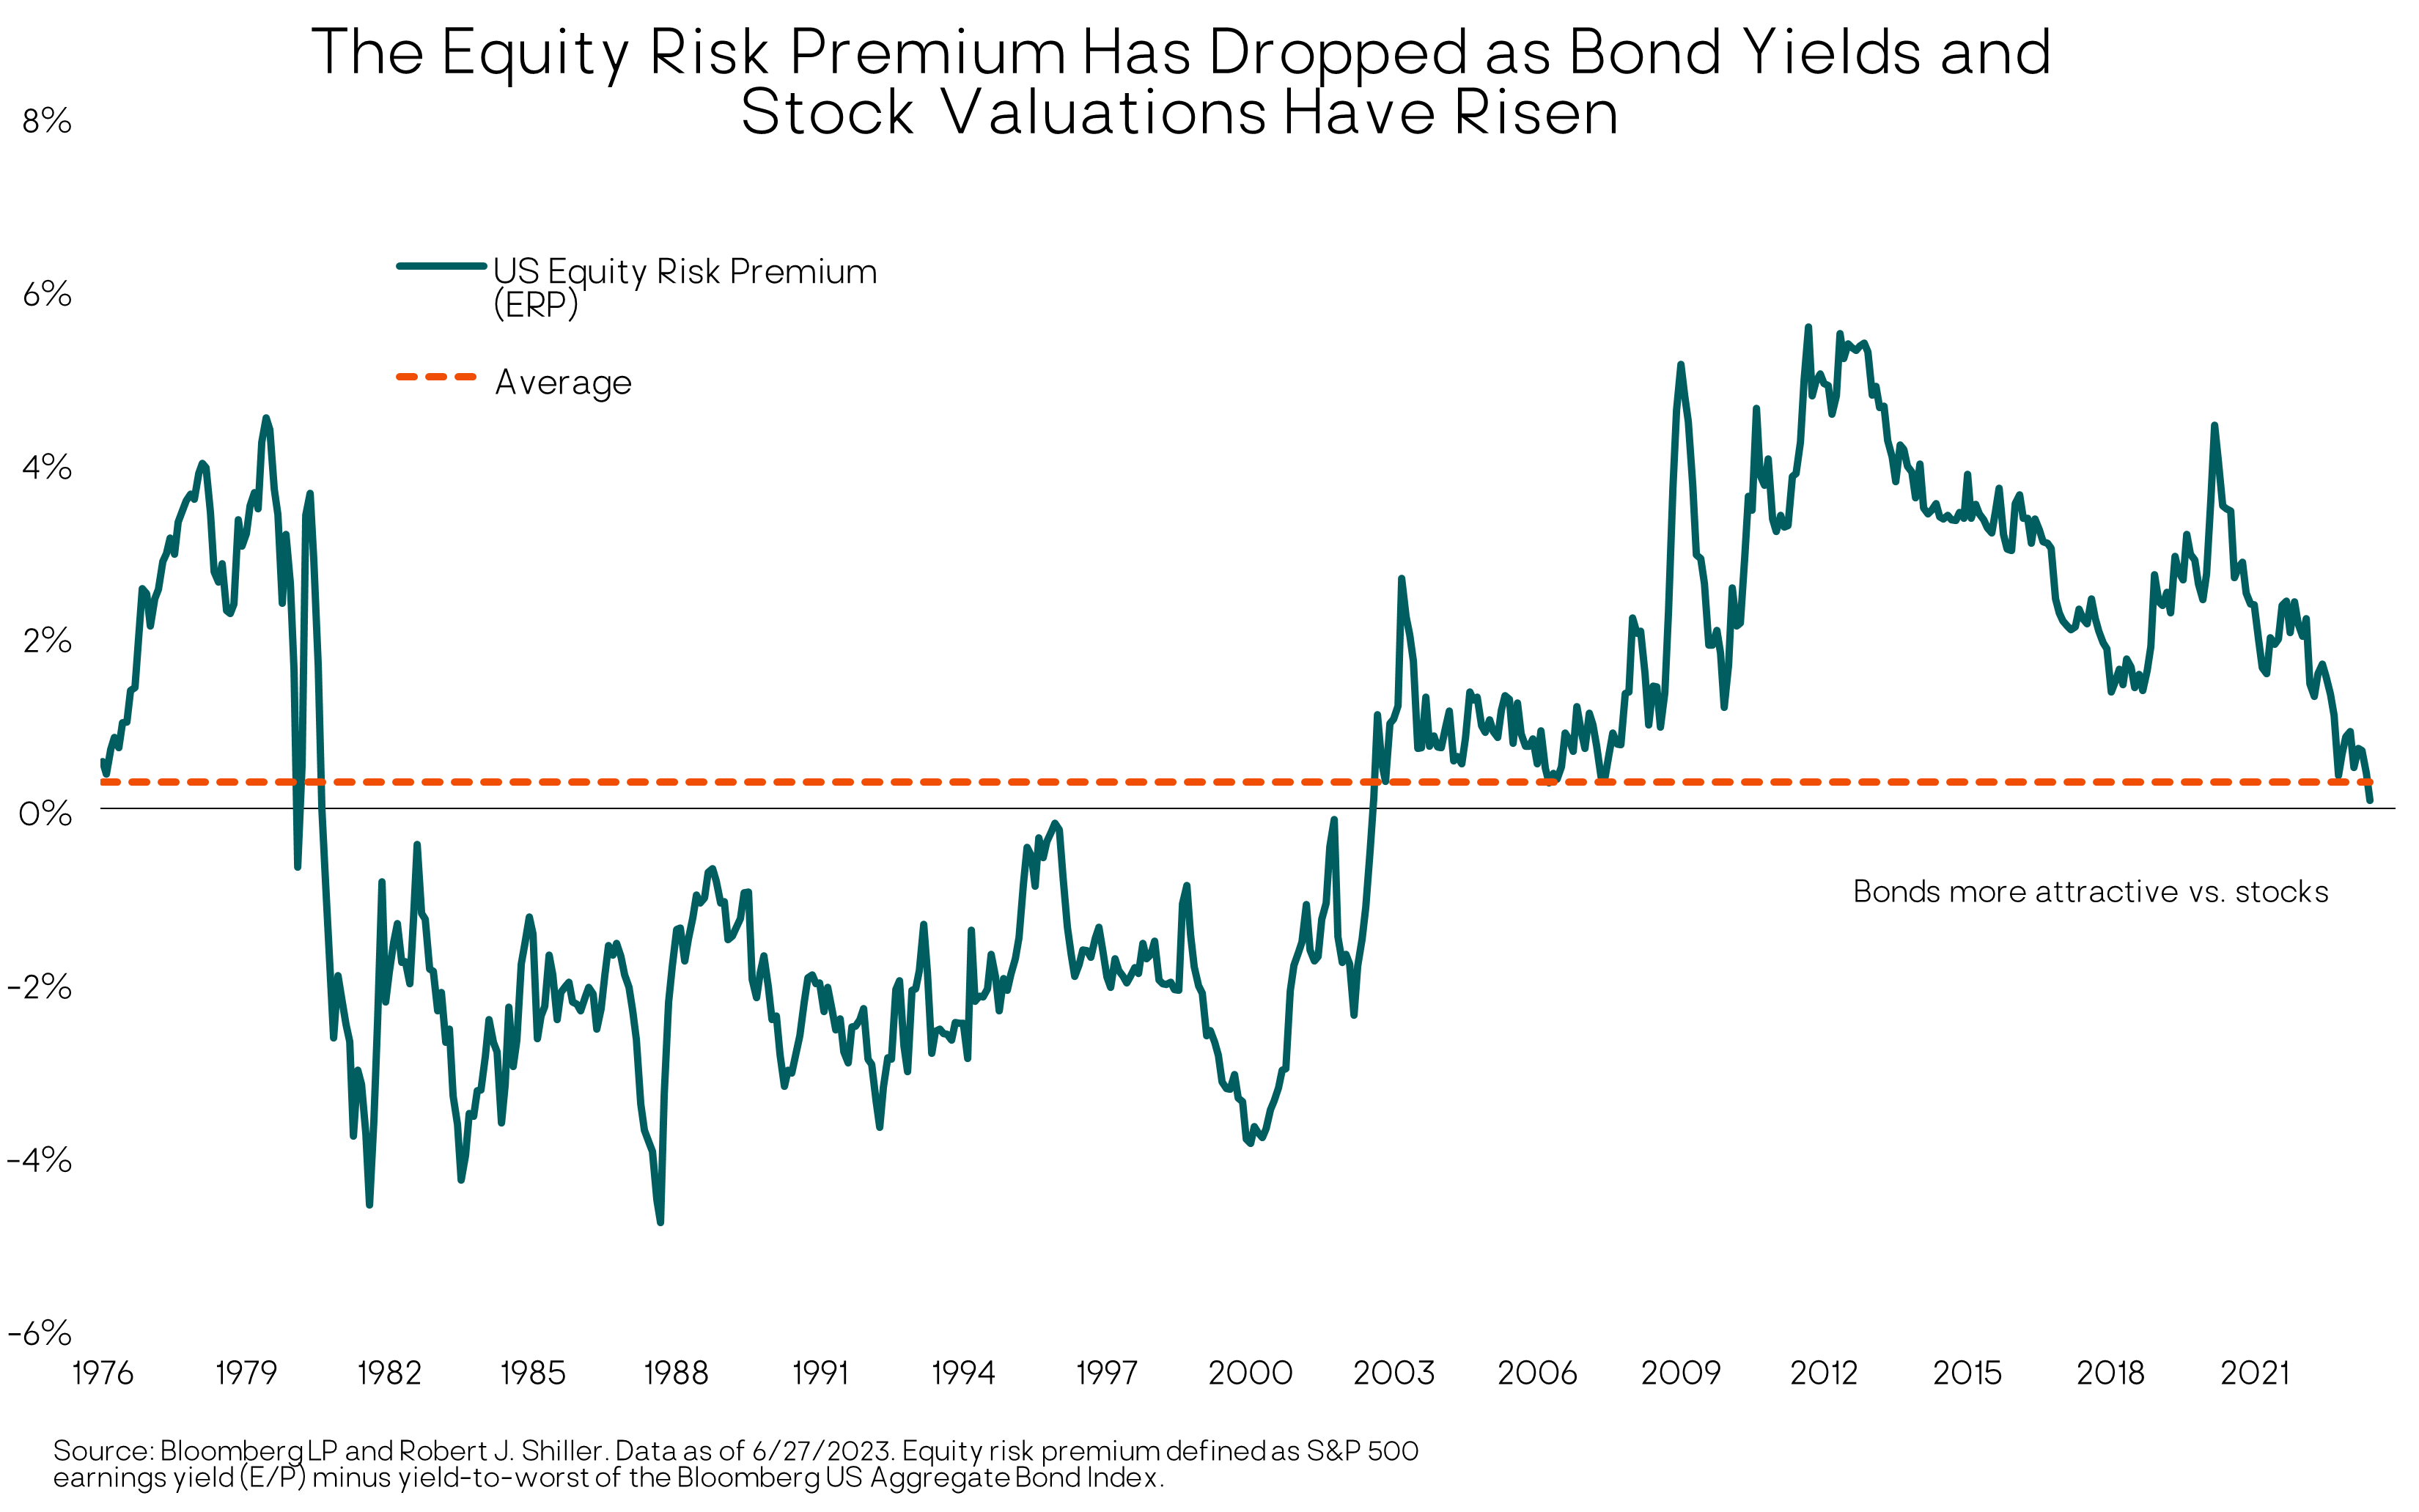
The Equity Risk Premium continues to drop
Higher core bond yields along with higher stock market valuations have made U.S. stocks relatively less attractive compared to core bonds. This relationship is known as the “equity risk premium” (ERP). There are many ways to calculate the ERP, but they are all a variation on taking the stock market’s “earnings yield” (which is simply the inverse of the P/E ratio) and comparing it to a “risk-free” bond yield (e.g., Treasury bonds or 3-month T-bills). They all point in the same direction: a below-average ERP versus the past 20-plus years. To revert to a more normal, i.e., higher, equity risk premium will require either a decline in equity valuations, lower bond yields, or some combination of the two.
Marketable (Liquid) Alternative Investments
Finally, we maintain core positions in trend-following managed futures and other alternative strategies. Managed futures returns were very strong in 2022 while traditional bond and stock investments fell double digits. This year has seen sharp reversals in some major market trends that caused losses for trend-following managed futures in the first quarter. However, the asset class as represented by the SG Trend Index rebounded nicely in Q2, gaining around 8%.
We remain confident in trend-following managed futures’ powerful long-term portfolio benefits in providing alternative and non-correlated returns relative to traditional stock and bond holdings. Trend following strategies are also much less dependent than traditional investments on any particular macro environment. That is, they can perform well whether the macro backdrop is deflationary, recessionary, inflationary, or growth-oriented.
Closing Thoughts
While a recessionary bear market is still our near-term (12-month) base case economic scenario, it may be a relatively moderate one given the strength of the labor market, ample household savings and solid business balance sheets. The Fed’s response will also be critical in terms of the timing and magnitude of when it starts cutting rates.
It is also quite possible the U.S. economy avoids recession this year, with inflation coming down towards to the Fed’s 2% target accompanied by only a mild increase in unemployment – i.e., with the brunt of the Fed tightening impacting job openings rather than actual employment.
Even in our recessionary base case, the stock market could rally further in the very short-term on (misplaced) optimism that the worst is over and recession has been avoided. But at some point, earnings will start getting revised lower and a recession priced into the market. The timing and magnitude are never certain, but the weight of the evidence supports sooner than later and the S&P 500 index at least revisiting its October 2022 low of 3600. That would be roughly a 20% decline from current levels.
However, as we extend our time horizon to the medium-term (five to 10 years), we see reason for optimism, or at least comfort. While the U.S. stock market in aggregate is vulnerable to earnings disappointment, there are companies and sectors within the U.S. market that are reasonably-priced, e.g., areas not swept up in the current AI frenzy. The fixed-income landscape is also attractive, thanks to higher yields and inefficiencies that can be exploited by skilled active managers.
We also see strong total return potential from developed international and emerging market stocks, which have been out of favor and underperforming for more than a decade. These markets are not “priced for perfection” as the U.S. market seems to be. Instead they are susceptible to “upside risk” – better-than-expected earnings growth and valuation expansion. While foreign markets will get hurt in a near-term recession, we don’t want to try to time getting out and getting back in given their attractive five-year return outlook.
We’re investors, not short-term market traders. Strong short-term market trends can trigger investors’ emotions and make them want to act – either chasing (buying into) a rising market or fleeing from (selling) a falling one. That is not the path to successful long-term investment outcomes. In addition, we have exposure to disciplined trend-following strategies that complement our longer-term valuation-based tactical approach.
Earning superior long-term returns does require one to take calculated risks when opportunities present themselves, but to also exercise caution during periods of market exuberance. By maintaining a disciplined and balanced investment approach, we are well-positioned to weather the inevitable market storms and capitalize on the opportunities that are also sure to arise.
– Litman Gregory Wealth Management
Important Disclosure
This report is solely for informational purposes and shall not constitute an offer to sell or the solicitation to buy securities. The opinions expressed herein represent the current views of the author(s) at the time of publication and are provided for limited purposes, are not definitive investment advice, and should not be relied on as such.
The information presented in this report has been developed internally and/or obtained from sources believed to be reliable; however, Litman Gregory Wealth Management, LLC (“Litman Gregory” or “LGWM”) does not guarantee the accuracy, adequacy or completeness of such information. Predictions, opinions, and other information contained in this article are subject to change continually and without notice of any kind and may no longer be true after the date indicated.
Any forward-looking statements speak only as of the date they are made, and LGWM assumes no duty to and does not undertake to update forward-looking statements. Forward-looking statements are subject to numerous assumptions, risks and uncertainties, which change over time. Actual results could differ materially from those anticipated in forward-looking statements.
In particular, target returns are based on LGWM’s historical data regarding asset class and strategy. There is no guarantee that targeted returns will be realized or achieved or that an investment strategy will be successful. Target returns and/or projected returns are hypothetical in nature and are shown for illustrative, informational purposes only. This material is not intended to forecast or predict future events, but rather to indicate the investment returns Litman Gregory has observed in the market generally. It does not reflect the actual or expected returns of any specific investment strategy and does not guarantee future results. Litman Gregory considers a number of factors, including, for example, observed and historical market returns relevant to the applicable investments, projected cash flows, projected future valuations of target assets and businesses, relevant other market dynamics (including interest rate and currency markets), anticipated contingencies, and regulatory issues. Certain of the assumptions have been made for modeling purposes and are unlikely to be realized. No representation or warranty is made as to the reasonableness of the assumptions made or that all assumptions used in calculating the target returns and/or projected returns have been stated or fully considered. Changes in the assumptions may have a material impact on the target returns and/or projected returns presented.
A list of all recommendations made by LGWM within the immediately preceding one year is available upon request at no charge. For additional information about LGWM, please consult the Firm’s Form ADV disclosure documents, the most recent versions of which are available on the SEC’s Investment Adviser Public Disclosure website (adviserinfo.sec.gov) and may otherwise be made available upon written request to compliance@lgam.com
LGWM is an SEC registered investment adviser with its principal place of business in the state of California. LGWM and its representatives are in compliance with the current registration and notice filing requirements imposed upon registered investment advisers by those states in which LGWM maintains clients. LGWM may only transact business in those states in which it is noticed filed or qualifies for an exemption or exclusion from notice filing requirements. Any subsequent, direct communication by LGWM with a prospective client shall be conducted by a representative that is either registered or qualifies for an exemption or exclusion from registration in the state where the prospective client resides.
Estimated Returns Disclosure
Scenario Definitions:
Downside: The economy falls into a deep and sustained recession for any of various reasons, such as deleveraging/deflation, unexpected systemic shock, geopolitical conflict, Fed or fiscal policy error, etc. At the end of our five-year tactical horizon, S&P 500 earnings are below their normalized trend and valuation multiples are below-average reflecting investor risk aversion. Inflation and 10-year Treasury nominal and real yields are very depressed.
Base: Consistent with long-term economic and market history, reflecting economic and earnings growth cycles that are interspersed with recessions around an upward sloping normalized growth trendline. Inflation is at or moderately higher than the Fed’s 2% target level and 10-year Treasury real yields are around zero percent to slightly positive. For the S&P 500, we now bookend our base case with a lower-end and upper-end estimate:
-
At the lower end of our base-case fair-value range, reflation efforts are successful and nominal economic growth is higher than the average. However, the economy overheats, and valuation multiple and some margin compression largely offset the favorable macro backdrop.
-
At the upper end, reflation efforts are also successful, nominal economic growth is higher than observed since the 2008 financial crisis on average, profit margins move slightly higher, and valuation multiples are also slightly higher than the recent historical average.