What We Can Learn from the “Magnificent Seven”
The Magnificent Seven, a group of stocks given the nickname by the financial media for their dominant performance in 2023 and their outsized weighting in U.S. and global market indexes, provide a helpful lesson in risks and rewards of concentration. The Magnificent Seven are Apple, Microsoft, Alphabet (Google), Amazon, Nvidia, Tesla, and Meta Platforms (Facebook). As of 12/18/2023 approximately 28% of the S&P 500 index is comprised of these seven companies. In this post we share a few interesting observations about the magnitude and impact of this concentration, some historical context from similar periods in the past, and how this influences our ongoing portfolio management.
In considering concentration versus diversification, very strong performance by each of the Magnificent Seven stocks so far in 2023 (ranging from 52% for Apple to 240% for Nvidia) has boosted their collective market cap relative to the rest of the S&P 500. In aggregate the group accounted for nearly 60% of the S&P 500’s 26% year-to-date return, which has driven their combined market cap to $13.8 trillion, and that is nearly one-third of the total S&P 500 market cap. Not surprisingly in the context of concentration versus diversification, the contribution to S&P 500 risk (in the form of volatility) from the Magnificent Seven is even greater than their contribution to market cap, as measured by research firm Qontigo.
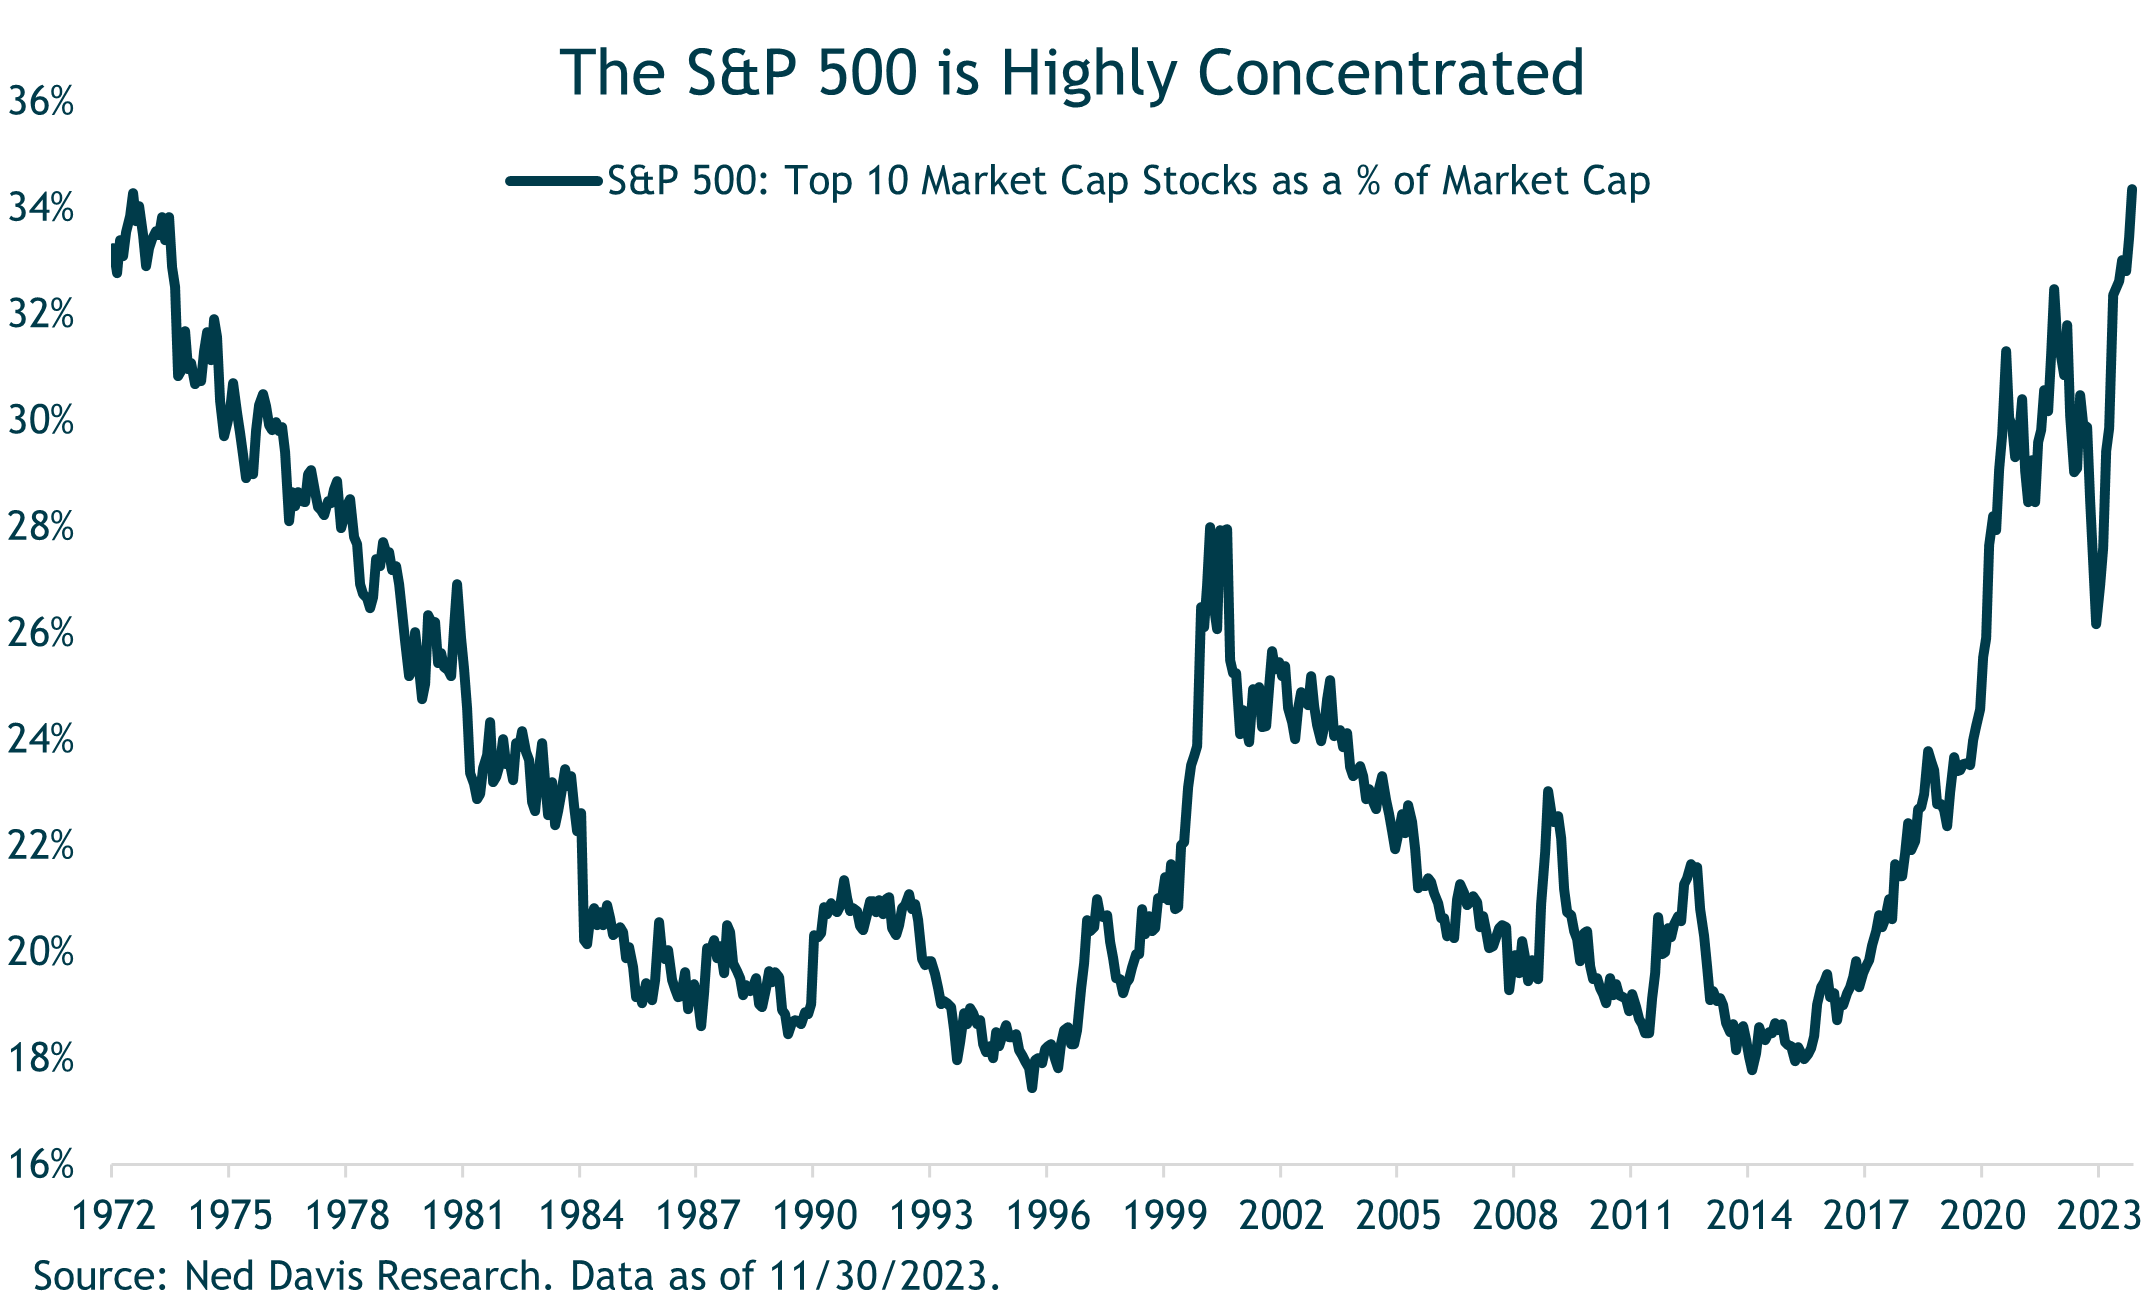
Historically there have been a few similar cycles in which a small number of stocks accounted for outsized percentage of the total S&P 500 market cap. The two most recent are the early 1970s, when the “Nifty Fifty” (Polaroid was a member) was all the rage, and in 2000 as the tech bubble approached its popping point. The chart below shows the percentage of total S&P 500 market cap accounted for by the 10 largest stocks going back to the early 1970s.
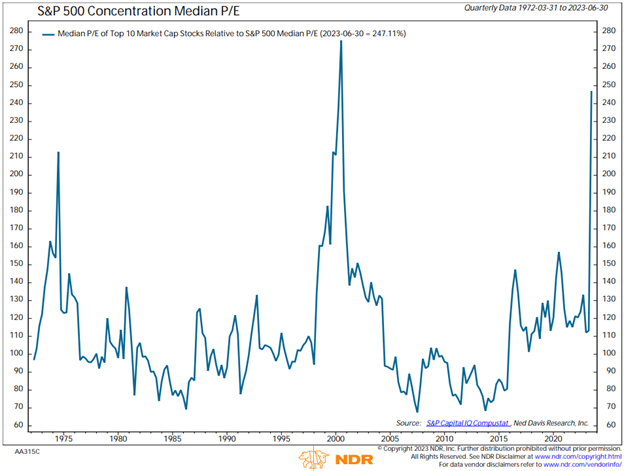
A hallmark of these periods where a smaller number of companies commanded an outsized market-cap share is that they also carried above-average price-to-earnings valuations, as the next chart makes clear. Here we can clearly see the points when valuation spiked for the 10 largest stocks in the S&P 500. While there’s not a perfect correlation between valuations and stock prices, it is true that valuation tends to inflate when the stock price climbs faster than actual earnings. Similarly, a falling stock price, or even one that climbs at a slower rate than earnings, brings valuations back down. So the peaks in valuations have generally followed periods of outsized returns, and the drops show that trend reverting.
The S&P is Pricey at the Top
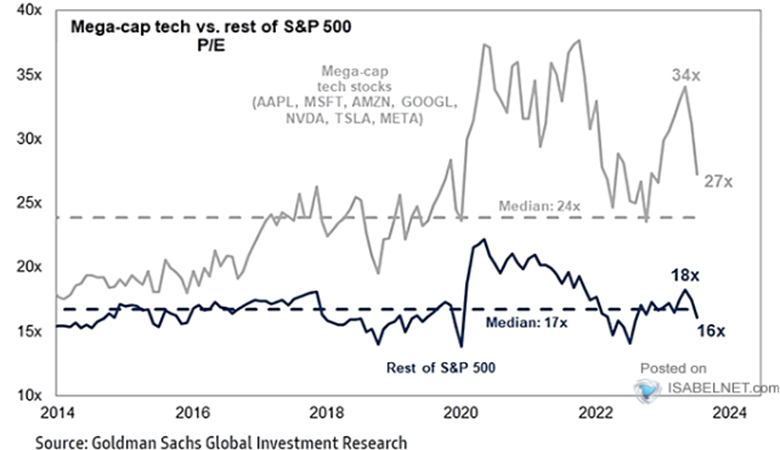
Taking a closer look specifically at the Magnificent Seven, in the chart below we can see the valuation expansion they experienced in recent years relative to the rest of the S&P 500. The greater volatility relatively to the broader index is also plain to see in the more dramatic ups and downs of the light grey line reflecting the price movement of the Magnificent Seven.
Rich Valuations for a Few, Fair Valuations for Many
What this means for investors in the cap-weighted S&P 500 index is simple: they have enjoyed generous returns thanks to the Magnificent Seven’s influence, but looking forward investors have more risk now by owning a large stake in a handful of expensive stocks with varying dependencies on difficult-to-predict technology developments.
Taking a step back to consider how this market trend affects our portfolio decisions, we first recognize that our investment process involves building portfolios to address defined risk and return objectives. This requires assessing potential risk within each investment we own as well as how various investments correlate so that we can create effective diversification and help our clients stay the course across full market cycles. When it comes to concentration, we have always favored investment managers we believe are highly skilled and who take larger positions in their highest-conviction investments. But in contrast, for capitalization-weighted market indexes, we know that portfolios become more concentrated simply when an individual stock’s price increase by a greater amount than the rest of the index.
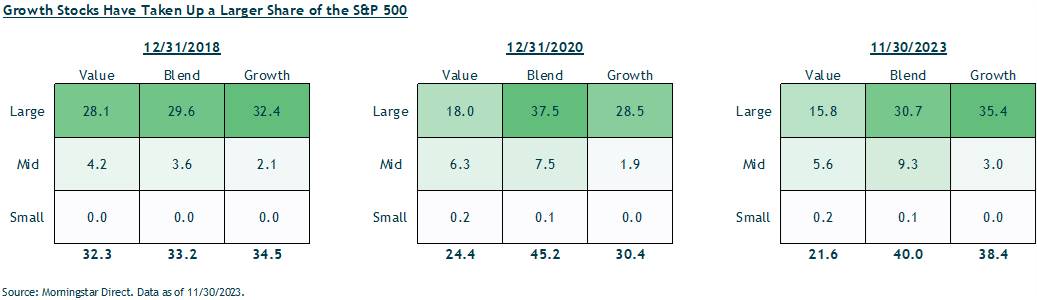
As an example, portfolios that have been in capitalization-weighted index investments during recent years have experienced this increased concentration as the weighting of the Magnificent Seven grew and shifted the S&P 500 toward the mega-cap and growth ends of the style and size spectrum. During this time, mid-to-smaller-cap companies and value companies have become comparatively less of the market cap of the index and are now more attractive on a relative value basis as shown in the chart below. The
degree to which this impacts diversification and potential downside risk for a particular portfolio is something we consider in our analysis.
Growth Stocks Take Up a Larger Share of the S&P 500
- The S&P 500 has over 40% in the growth bucket
- Value stocks mark up less than 25% today
- Historically, the growth/value mix is more equal
While we appreciate the strong contribution to performance from the Magnificent Seven (as we have from other strong growth companies in the past) we also understand how cycles work and the degree to which a major performance run can affect the balance and diversification in the portfolios we manage. For that reason, we are regularly looking for opportunities to rebalance and better align the equity allocation within our client portfolios. In the end, we do not try to predict and bet on short-term trends, but instead construct portfolios so they take on the appropriate levels of risk and potential return to meet our clients’ goals.