Our Current Thoughts on Emerging Markets
The Recent Divergence Between Emerging-Market and US Stocks
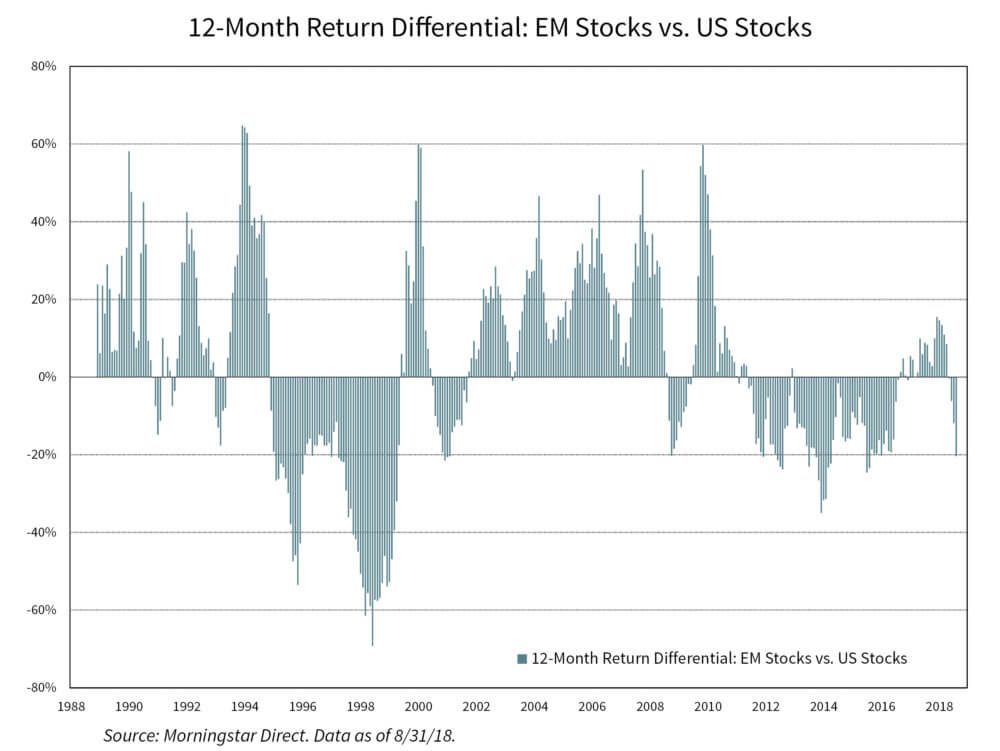
After a strong absolute and relative 2017, emerging-market (EM) stocks have significantly underperformed their US counterparts this year. The performance differential so far this year, as of August 31, now stands at over 17 percentage points (a gain of 9.8% for US stocks and a loss of 7.7% for EM stocks in the first eight months of 2018). This underperformance is not outside of the norm for EM stocks, as the chart below shows. It’s worth noting that many times across history investors in emerging markets have been rewarded with positive divergence, as was the case last year.

The prospects of an expanding trade war between the United States and China has impacted investor sentiment for emerging markets. Investors are concerned it will lead to a slowdown in China and the rest of the emerging markets. While it’s true that China’s linkage with other emerging markets has become stronger over the years, it’s also true that its contribution to global GDP growth is significant and it would negatively impact US growth too. In addition, as we have written in the past, it’s not obvious that a longer-term trade war would be less negative for US stocks. US companies have significant operational exposure to China through direct and indirect supply chain networks. Unwinding these would not be easy and would certainly be costly. There are anecdotal examples of companies stating that moving their supply chain to the United States would make them uncompetitive. Further, many US companies are holding back capital investment due to uncertainty stemming from this trade war talk. This would ultimately hurt US growth. Finally, a trade war is likely to result in higher inflation in the United States. Our base case has been that a full-fledged trade war is unlikely since it’s in neither country’s interest. But it’s possible we could be living in a world with trade tensions for a while. See our June 2018 note that delves into this issue.
Another factor behind EM underperformance has been the rising US dollar. In part that’s been a function of rising rates and better GDP growth in the United States—the latter stems to some extent from the fiscal stimulus in the form of tax cuts. Longer term, we believe this fiscal stimulus, at a time when we are at full employment and when companies are flush with cash and continue to use a good chunk of it to fund buybacks at what we believe to be significantly overvalued levels, would be unproductive and cause fiscal deficits and debt levels to rise. This in our opinion will be a long-term headwind for the US dollar and positive for EM stocks, especially for commodity-oriented countries.
The divergence in US vs. EM performance has been further accentuated by better earnings results from US companies. These results are driven in part by the well-telegraphed tax cuts and better sales growth, the latter reflects relatively stronger GDP growth in the United States.
Digging into Some EM-Related Concerns
It is hard to miss the negative headlines related to emerging markets these days. None of the concerns we read or hear are new though. Below we briefly address a few:
Concern One: Turkey and Argentina Will Cause Contagion in Emerging Markets Like the Late 1990s/Early 2000s
Turkey is a very small weighting in the EM index (less than one percentage point) and Argentina is not even in it. The fact that they are going through a crisis when the US dollar is rising is not a surprise given their poor fundamentals, such as large current account deficits, which makes them more beholden to foreign capital. In contrast to the late 1990s, the rest of the EM countries’ fundamentals are healthier: better current account balances on average, floating instead of fixed exchange rates that prevent excessive build-up of debt in foreign currencies, and higher foreign exchange reserves to finance imports and ward off speculative attacks in their currencies if necessary. In summary, many EM countries have less of a need to borrow and, as a result, they are relatively less dependent on foreign capital. As such, we believe the risk of a broad-based contagion in emerging markets is much lower today than over two decades ago.
Concern Two: EM External Debt Levels are Similarly High as in the Late 1990s
These headlines tend to return when EM currencies are weak, and we have discussed this issue in our June note as well. In a few countries, dollar debt does seem to be a problem, but for most it’s not. Capital Economics estimates EM foreign exchange reserves (most of which are denominated in foreign currencies, including the dollar) are, in aggregate, about the same size as emerging markets’ external debts now, whereas they were only about 30% of the size of external debts in the late 1990s. So, EM countries now have better debt coverage. Second, at the sovereign level, most EM debt is in local-currency terms (external debt measures include local debt held by foreigners, according to BIS and Capital Economics, and should not be interpreted as US dollar debt alone). So, there is less of a currency mismatch between borrowings and payments at the sovereign level.
On the other hand, private sector debt, mostly corporates, denominated in US dollars does appear to be relatively high and is a question we raised and looked at several years ago. There are a few mitigating factors we’d point to. Some EM exporters, especially in the resource sector, which has a relatively large exposure to US dollar debt, have a natural dollar hedge because their revenues are in US dollars (commodities are priced in US dollars). Second, dollar debt among EM financials has risen over the years. This has coincided with an increase in intra-EM trade (EM countries tend to trade with each other in a common currency, such as the US dollar, so banks fill that intermediary role). Rising intra-EM trade is good for EM countries as it lowers their linkage to or dependence on the United States.
Private sector debt in China is a potential source of concern. This speaks to the China-credit-boom risk we have discussed since 2011/2012, a risk factor we believe we have adequately factored into our base-case scenario going as far back as September 2015 when we initiated a small tactical overweight to EM stocks in our conservative models. Of course, our scenario analysis is focused on the long term, and we know the shorter-term downside risk from a disruptive unwinding of China’s credit excesses can be significant. One mitigating factor is that China has large foreign exchange reserves, including in US dollars, that they can utilize to back-stop companies critical to its economy, such as banks. We have not and are not counting on this though. This is an important reason why our overweight in EM stocks has been relatively small.
A final point on this external-debt topic. The fact that most EM countries have floating rather than fixed currencies helps release pressure in their economies (i.e., it lowers the likelihood of sharp foreign exchange declines that result in deep and sudden crises). It also places them in a stronger position to benefit from an inevitable improvement in global growth.
It’s notable we didn’t see major corporate debt defaults in EM countries despite significant EM currency weakness after the Federal Reserve taper tantrum and when energy prices tanked in 2014/2015. The weighted MSCI EM Currency Index fell 16% from July 2014 to January 2016. (To give some context, this index rallied 22% through its April 2018 peak, and since then has declined by about 8%, as of September 13, 2018.) According to data from Ashmore, during this period EM high-yield corporate default rates barely nudged higher than their US counterparts, and since early 2016 have remained relatively low in both absolute and relative terms (in the low-single to mid-single digits). This recent history suggests to us EM corporations are more resilient than the media headlines make them out to be.
Concern Three: On a Sector-Equivalent Basis EM Stocks are not Cheap Relative to US Stocks
- Emerging markets historically have had greater exposure to cyclical sectors, such as materials and energy. That’s partly why they have typically traded at a discount to US stocks. We continue to apply this discount in our modeling of EM stocks and still find them attractive relative to US stocks.
- Since the early 2000s, EM exposure to material and energy sectors has decreased. Part of it is driven by these sectors’ underperformance and is indicative of the opportunity there. Moreover, we have seen EM sector weights to growthier areas, such as technology and consumer, increase such that their weightings resemble that of the US market now.
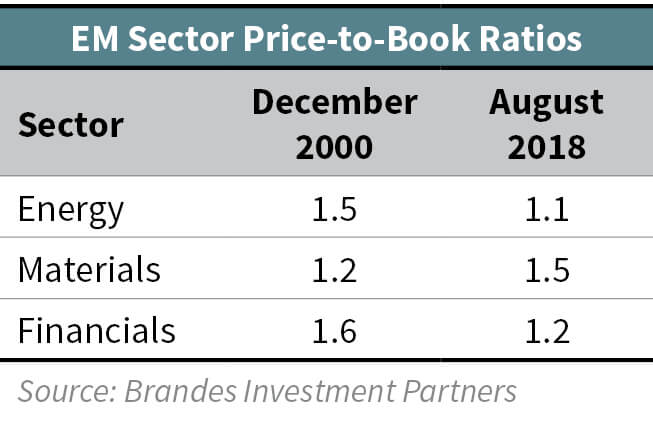
- EM stocks remain attractive even on a sector-equivalent basis and even by this measure trade at a 20% discount to US stocks. (Most of the reduction in the EM discount, from about 35% to 20%, comes from EM’s lower weighting in health care.) In the financial media, commentators argue that cyclical sectors in emerging markets are a value trap. We’d say it depends on investors’ time horizon. These cyclical sectors, as in the United States, are levered to growth and remain an important part of the EM investment opportunity set. Growth may have slowed down from last year, in large part because of rising trade war risks, but growth will eventually recover. Based on index-level data from Brandes Investment Partners, cyclical sectors such as materials, energy, and financials are similarly cheap today as they were in the early 2000s before EM stocks went on to outperform. See the table to the right that compares price-to-book ratios, a relatively stable valuation measure, across two periods.
Final Thoughts
Starting valuations matter a lot in our opinion. In part because emerging markets were cheap going into the early 2000s bear market, they outperformed the US market in the 2001 and 2002 calendar years.

Based on our normalized-earnings framework, EM stocks are currently significantly cheap relative to their US counterparts. Looking at normalized valuations another way, according to Research Affiliates, prior to the 1997–1998 EM Asian crisis, the EM CAPE (cyclically adjusted price-to-earnings ratio) was trading at a premium to the US CAPE. Today, EM stocks trade at a CAPE of 13x compared to 30x for US stocks. No matter how we slice it, our analysis suggests the US market, on a relative and absolute basis, looks like the most expensive stock market in the world and, as a result, in our view presents one of the biggest risks to our portfolios in the medium to long term.
The shorter-term risk that poor investor sentiment leads to capital outflows and contaminates EM fundamentals remains. This has always been a risk with emerging markets. As disciplined investors, it’s our job to distinguish between noise and fundamentals and short term vs. long term.
We have expressed our concerns related to China’s debt-driven spending on potentially low-returning projects, such as infrastructure, for many years now. At a time when China is digesting this debt, trade wars and the resulting growth slowdown do not help and increase shorter-term risk with emerging markets. But we are longer-term investors and are currently assessing whether the recent performance divergence offers us an attractive opportunity to increase our overweighting to EM stocks, while balancing shorter-term downside risk across our portfolios. As always, we continue to analyze new data and information, and if our analyses warrant we change our positive view on EM stocks, we will.
—Rajat Jain, CFA
