Research Update: Increased Return Expectations for U.S. Stocks
Over the past six to nine months, as we reviewed the changing market and economic environment, our expected returns for U.S. stocks have increased. We are also giving greater weight to more optimistic return scenarios. The result of this analysis has given us confidence in increasing the allocation to U.S. stocks in our portfolios. In this post we summarize our recent analysis and why we think an increased allocation will improve the risk-adjusted return profile of our portfolios as the economy and markets continue their recovery from the pandemic’s impact.
Reflation
The Federal Reserve and the Biden administration have been successful so far in their reflation effort. We expect to see higher average economic growth in the upcoming cycle than we have seen since the 2008 financial crisis. That should translate into strong, broad-based earnings growth for U.S. stocks.
Excepting China and other north Asia countries, the United States is emerging from the pandemic as the country in the best shape due to our successful vaccine rollout. Other positives: Bank balance sheets are strong, which will support lending; households have deleveraged and are now flush with savings, which will support consumer spending; and we will likely get more fiscal stimulus in slow drips over the coming years. Coming out of a recession, we are relatively early in the cycle. Double-dip recessions are something investors often fret about, but they are exceedingly rare. There’s only been one since the Great Depression.
Low Real Interest Rates Are Likely to Persist and Support Relatively High Valuations 
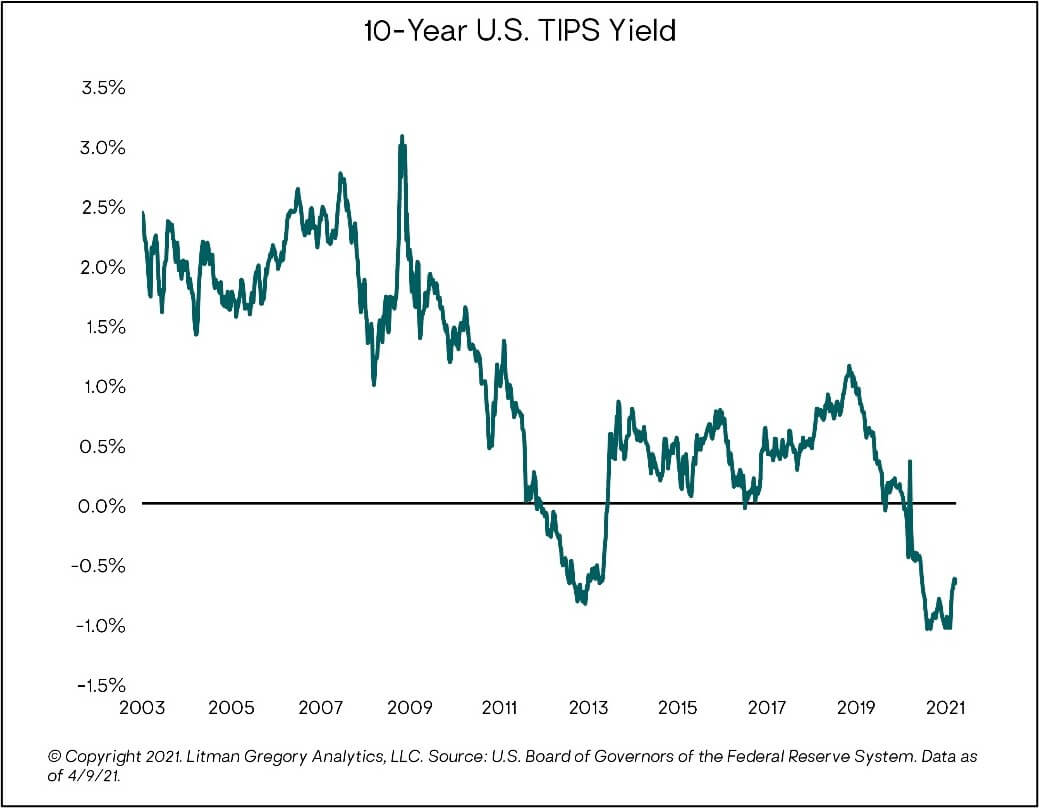
We do not view a sustained and material increase in U.S. inflation as likely over the next couple of years. In the very near term, we see higher inflation, but we agree with the Fed that it is a result of the recovery and will likely be transient. Our upgraded view of U.S. stocks aligns with this view. Without a sustained rise in inflation, the Fed can keep its word and hold real interest rates low for a long time, which we believe would support slightly higher valuations than we have seen since the 2008 financial crisis on average.
Yes, interest rates have risen sharply from their lows in the fall of 2020, but real rates remain quite low compared to history. We see the rise in rates this year as the market pricing in reflation. While we expect interest rates to gradually rise over the next few years, they should remain relatively tame. So, core bonds yielding less than 2% or even 3% will continue to offer weak competition for stocks. In a low-rate environment like that, a mid- to upper-single-digit return from stocks is a fair return. And there are decent odds returns end up being more positive, driven primarily by better-than-expected earnings growth, in our view.
Margins Are Likely to Stay High

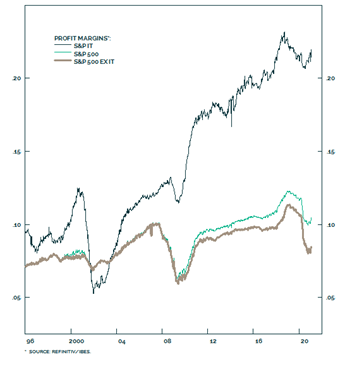
Source: BCA Research
The pandemic has accelerated many technology trends (like virtual work) that we think could largely offset many of the pressures we see on profit margins (such as from deglobalization). It is likely that S&P 500 companies will continue to eke out efficiency gains and benefit from scale and network effects as they have the past two decades. In that environment, we may not see profit margins revert or even partially revert back to long-term historical averages, as we had been expecting in our base case. Instead, they may stay high, supporting relatively higher valuations. The chart to the right from BCA Research shows profit margins have generally been on an upward trend for the past two decades. If anything, we think the odds are good that profit margins will move up a notch further in this cycle. We are factoring this into our upside case, which as we mentioned, we are weighing as part of our overall assessment of U.S. stocks.
The Downside Risks We Are Watching
The major risks to our base case, and the mitigating factors, are as follows:
- U.S. reflation efforts may not yield the expected growth. This could mean the underlying fundamentals of the economy turn out weaker than we think. We capture this outcome in our downside scenario, but we think it is unlikely given the fundamental and economy data we are seeing this year.
- If inflation surprises on the upside, the Fed may be forced to raise rates higher and faster than it currently anticipates. This could cause markets to decline steeply in the short term (maybe 10% to 20%) given relatively high current absolute valuations. However, we think the Fed has the tools to manage long-term inflation expectations to keep them anchored.
- Markets could force rates significantly higher given the United States’ large deficit spending. We think this scenario is unlikely given the U.S. dollar’s reserve-currency status and the Fed’s ability to repress long-term rates, similar to what it successfully did after World War II.
- Lastly, the Fed’s focus on its employment goals may encourage it to keep monetary policy easy for far too long and risk financial bubbles. There are already some worrying signs of excessive risk-taking in special purpose acquisition companies (or SPACs), cryptocurrencies, and small-cap growth stocks. The odds of this scenario increase if the acceleration in technology trends makes it difficult for the Fed to achieve its expanded definition of “full employment.” However, at present, we don’t think overall markets are close to being in egregious or bubble territory.
Putting It All Together
Given our improved confidence and plan to add to U.S. stocks, our more conservative portfolios will be only slightly underweight to equity risk overall, and our balanced portfolios with larger equity allocations will be slightly overweight. Note, our upgrade of U.S. stocks doesn’t change the fact that emerging-market stocks remain more attractive in our eyes. Our expectations for U.S. stocks provide a higher hurdle for emerging-market stocks to clear in our relative analysis. But the return gap still favors emerging-market stocks. Moreover, we see potentially additional upside for emerging-market stocks once we move past COVID-19. To sum up, we believe investors are being fairly compensated for taking on benchmark or slightly-above-benchmark equity risk. As always, we will be willing to change our views based on new data points and/or analyses.
To read the more detailed research update on U.S. stocks, please visit the full report here.
For more details on our analysis, or a review of your portfolio, don’t hesitate to reach out to your advisor for a discussion.
