First Quarter 2024 Investment Commentary
First Quarter Market Recap
In the first three months of 2024, the U.S. economy remained resilient despite short-term rates sitting near 20-year highs. Noteworthy in the quarter was the continuing robustness in the labor market, stronger-than-anticipated corporate earnings, and a convergence of market participants’ aggressive forecast of rate cuts with the Fed’s own projections. Retail sales pulled back, but the trend remains positive.
These factors contributed to optimism around a soft-landing scenario and provided a supportive backdrop for stocks. The S&P 500 Index continued to reach new highs throughout the quarter, gaining 10.6% in the three-month period. Large-cap stocks (S&P 500 Index) decidedly outperformed small-cap stocks (Russell 2000 Index), and growth stocks (Russell 1000 Growth) again beat value stocks (Russell 1000 Value). The equal-weighted S&P 500 has returned 7.9%, trailing the more traditional cap-weighted S&P 500 index by about two and a half percentage points in the quarter, demonstrating that a few of the largest companies are having the most impact on the index.
Developed International and emerging-market stocks also posted gains but did not keep pace with the U.S. market. Developed International stocks (MSCI EAFE) gained 5.8%, while emerging-market stocks (MSCI EM Index) posted a 2.4% return. Japanese stocks (MSCI Japan) were the standout performers in the quarter, gaining over 11% in dollar terms but over 19% in yen terms.
In the bond markets, returns were mixed in an environment where the benchmark 10-year Treasury yield rose from 3.88% to 4.20% as markets reduced their expectation of Federal Reserve rate cuts from more than 150 basis points to just shy of 70 basis points (as of April 3) for the year 2024 and adjusted the start of this easing cycle from March to June. In this rising-yield environment, the more interest-rate sensitive Bloomberg U.S. Aggregate Bond Index declined 0.8%. Credit performed relatively well in the quarter, as high-yield bonds (ICE BofA High Yield Index) were up nearly 1.5% in the quarter.
With three consecutive months of positive returns, some believe this bodes well for stocks in 2024. At the same time, there are some increasing concerns about investor complacency, as a few indicators are hinting at the possibility of a recession. All eyes continue to be on the Federal Reserve, with an increasing—but still low—possibility of an alternate scenario where rate cuts will not occur in 2024.
Macroeconomic and Investment Outlook
The U.S. economy has continued to prove resilient despite the Fed maintaining a higher level of interest rates for longer than most expected. A main driver of this better-than-expected economic growth has been the continued strength of the U.S. consumer. The combination of robust job gains and steady positive real income growth has allowed consumers to continue spending despite higher rates. The resiliency of the economy has also benefited corporate earnings. And after a decade of near-zero interest rates, companies are generally well positioned financially with balance sheets that are healthier than they have been in past tightening cycles.
According to the Atlanta Fed, the real GDP growth estimate (as of April 1st) for the first quarter of 2024 is expected to be 2.8%. This estimate is not an official forecast of the Atlanta Fed. Rather, it is best viewed as a running estimate of real GDP growth based on available economic data for the current quarter. There are no subjective adjustments made to GDP—the estimate is based solely on the mathematical results of a model. If the growth rate holds above 0%, it would be the seventh consecutive quarter of economic growth. Looking to the longer term, the Fed expects real GDP to be 2% in both 2025 and 2026, with inflation returning to their 2% target.
The Fed, Inflation, and Rates
Inflation has been stubborn and remains above the Federal Reserve’s 2% target. That said, inflation (CPI) has declined meaningfully over the past year, falling from nearly 6% to just over 3%. Our expectation has been and continues to be that inflation will trend lower over the remainder of 2024, although likely not in a straight line. Shelter, as a main component of the CPI, has been a primary factor in keeping inflation elevated and we expect this input to decline, leading to lower headline rate inflation.
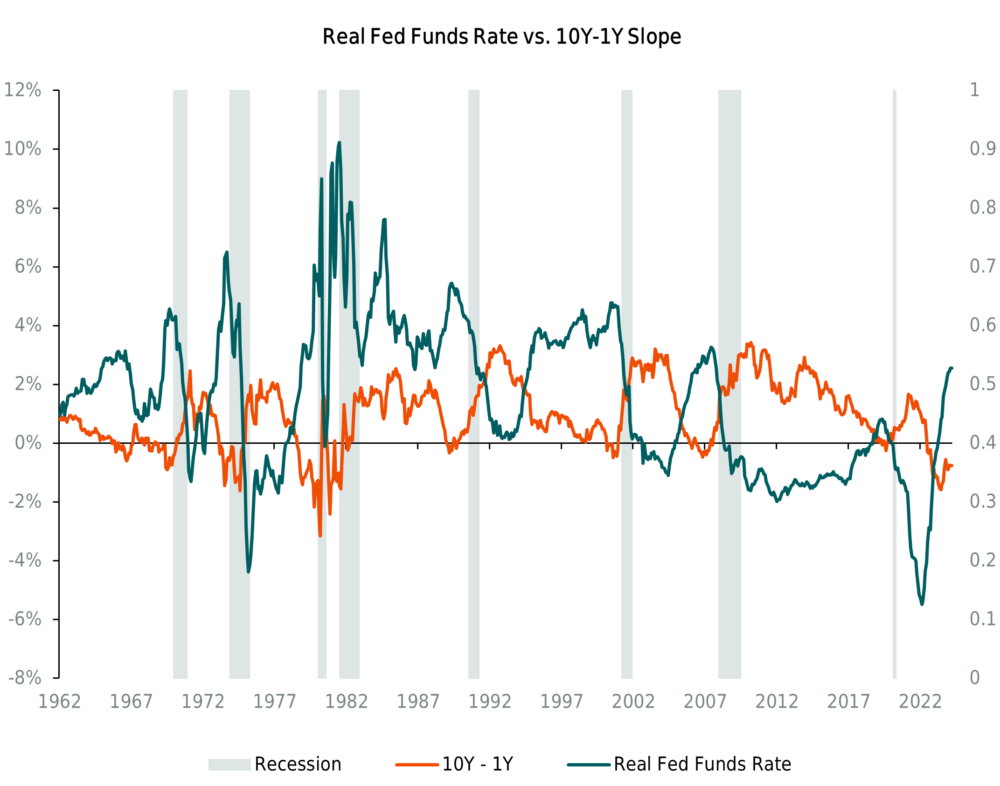
We currently believe that Fed policy is borderline restrictive given current inflation levels. In the chart below we can see that since the 1960s, an inverted curve combined with sharply higher real fed funds preceded a recession. In the most recent cycle, however, we can see that while the yield curve has been inverted since July 2022, Fed policy was very accommodative for most of that time, i.e., the real Fed Funds rates were sharply negative when the curve first inverted. It’s only more recently that Fed policy has started to move toward restrictive levels. In prior cycles, real Fed Funds proved restrictive at the 3.5% (or higher) level. To the extent that inflation continues declining, and the Fed keeps rates unchanged, Fed policy will become proportionately tighter, and could reach a level that significantly slows the economy. So, if inflation continues to decline the Fed will need to incrementally cut rates in order to keep the same degree of tightness in monetary policy.
To be sure, we think the Federal Reserve will be cautious with the timing and magnitude of rate cuts. We are currently in line with consensus expectations that the Fed will cut by 25bps in June, with two more cuts later in the year. But with inflation remaining above the 2% target, cutting too early could create a second wave of inflation (and likely send risk assets higher, at least initially), but waiting too long could put pressure on the consumer and lead to a recession. Meanwhile, it’s possible, but unlikely, that the Fed may not cut rates this year and will maintain the current range of 5.25%–5.5% for the rest of 2024. If this later scenario does occur, the bond market would need to reset and longer-term interest rates would very likely move higher.
The Fed seems to be singing a slightly different tune around inflation and rates. For quite some time, Fed Chair Powell has said that he wants to see inflation reach the 2% level and have confidence it will remain at or near that level before cutting rates. In a recent speech, however, he expressed the expectation of cuts, although the Fed’s preferred measure of inflation, the Personal Consumption Expenditures (PCE) Price Index remains above its 2% target at 2.4%. These two statements don’t fully line up, which we think is creating some ambiguity and we think this will likely keep longer-term bond yields in a trading range until there is some clarity around rates and inflation.
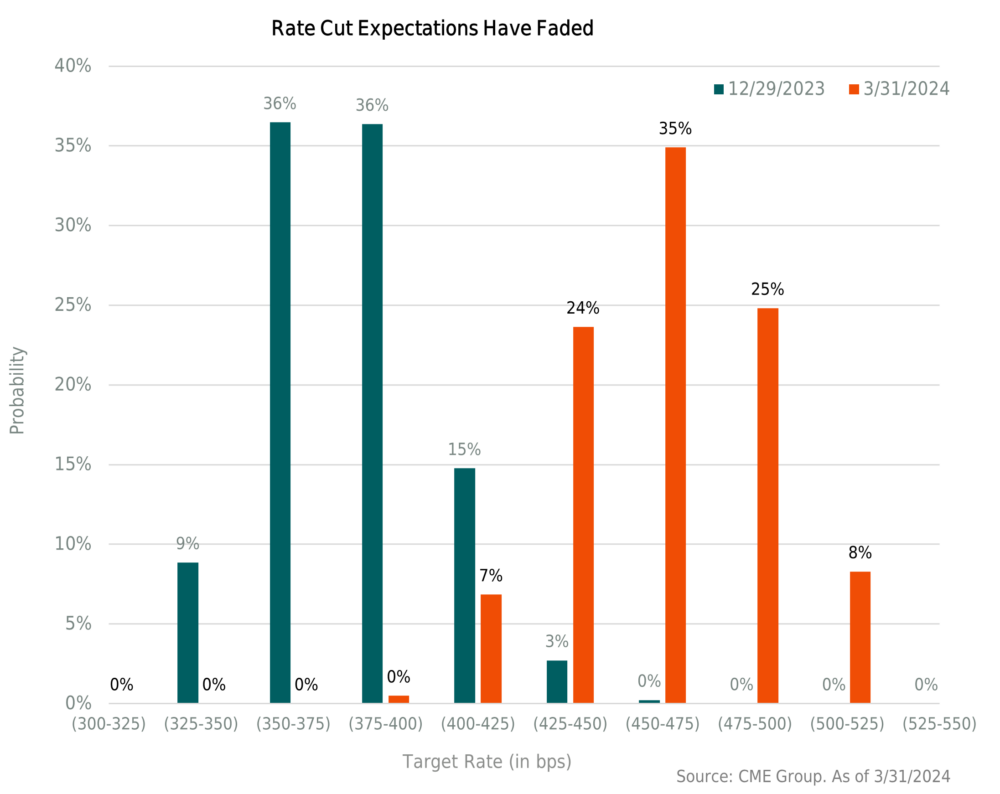
Economic growth in and of itself does not cause inflation, and ongoing modest growth is not a reason for the Fed to avoid cutting rates. However, persistent growth of around 2% does make it difficult to foresee aggressive rate cuts, and we’ve seen this reflected in the market’s expectations during the quarter. In the chart below, we see that at the beginning of the year, the market was anticipating six to seven rate cuts (shown in blue). But today, the market’s expectations (show in green) have tempered, and the consensus is for three rate cuts bringing the top end of the Fed Funds range to 4.75% at the end of 2024.
Investors have become used to the Fed cutting rates meaningfully or not at all. In a prior commentary we referred to the Fed often stair-stepping rates higher and then dropping them aggressively in an elevator-like fashion to fend off a recession. If the Fed is able to engineer a ‘soft landing’ of the U.S. economy with inflation converging to 2% and growth continuing, they can incrementally cut and ensure that policy does not become too restrictive. In the near-term, we think it’s possible that the Fed does some fine-tuning of rates without implementing the type of broad policy shift to which we have become accustomed. If a recession does occur later this year, the Fed will have the ability to swiftly and meaningfully cut rates given current levels.
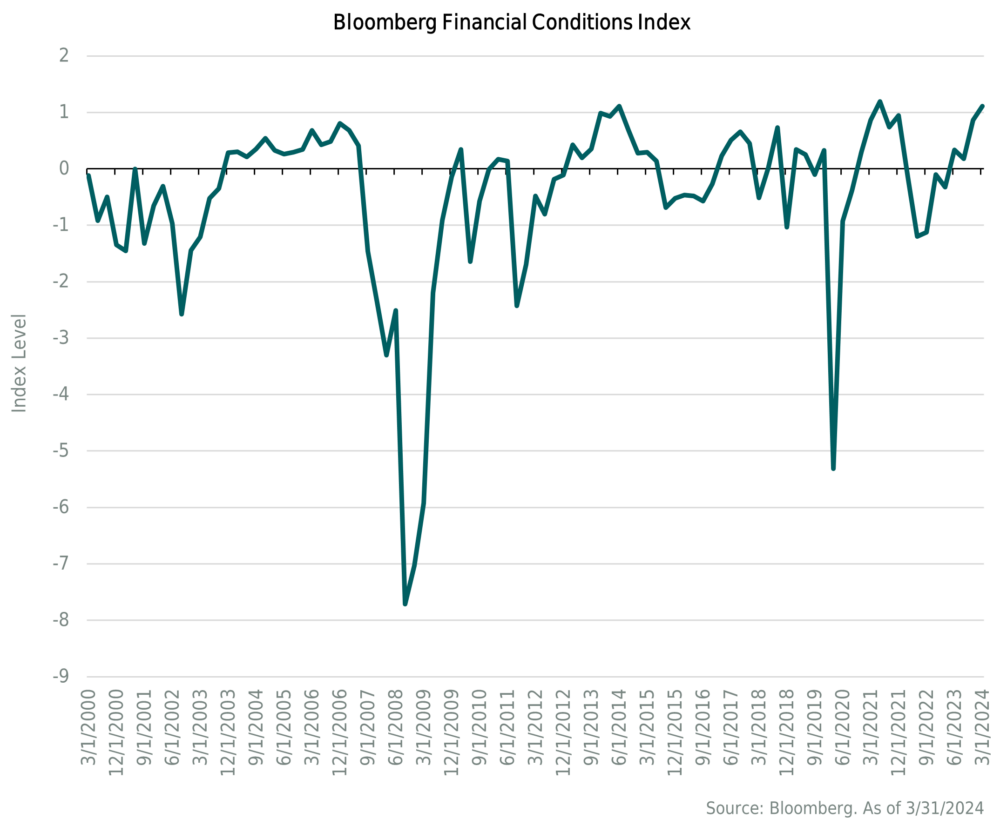
For now, U.S. economic data seems supportive of growth, not contraction. In addition to the Fed’s 2% forecast for real GDP in 2025 and 2026, a number of indicators are showing positive trends. The Bloomberg Financial Conditions Index, shown below, represents a comprehensive array of risk indicators including interest rates, credit spreads, equity market performance, and currency movements. The index is designed to provide insights into the ease or difficulty with which businesses and consumers can access financing and credit. A positive value indicates accommodative financial conditions, while a negative value indicates tighter financial conditions relative to pre-crisis norms. This indicator has reached one of the highest levels in the past four years.
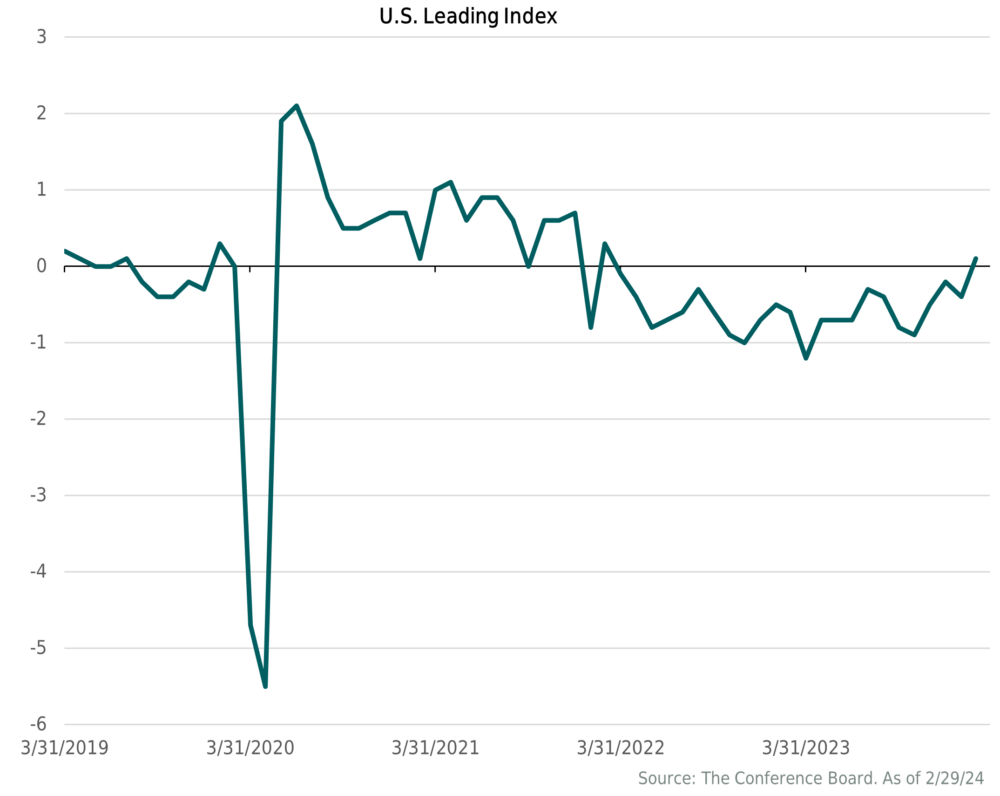
Another element is the Conference Board’s U.S. Leading Economic Index (LEI), a composite index which combines several economic indicators to forecast economic trends in the U.S. Components include average weekly hours worked in manufacturing, new orders for consumer goods and materials, building permits, among others. The goal of this index is to identify turning points and trends in the U.S. economy. A rising LEI typically suggests improving conditions and a declining value may indicate economic weakness or downturns. This indicator has been negative on a monthly change basis from April 2022 to February 2024, before recording its first positive change in two years in March. We should also point out that this indicator historically has a good track record of predicting recessions, although it incorrectly predicted a recession in this last cycle.
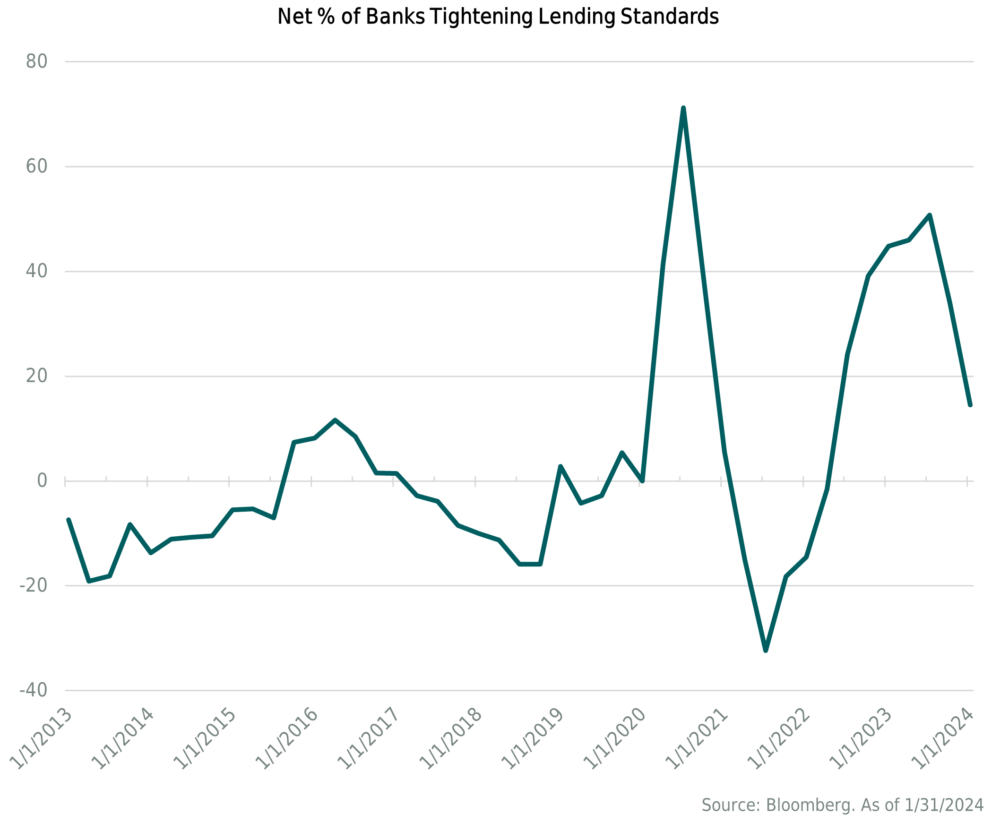
We should also highlight that there has been a loosening of bank lending standards. The chart below shows that fewer banks tightened lending standards during the fourth quarter of 2023 in a sign that small businesses might soon see broader access to loans. The percentage of banks that tightened lending standards for commercial and industrial loans fell to 14.8% in the fourth quarter, down from 33.9% in the third quarter and a meaningful drop from 50.8% in the second quarter of 2023. The survey showed a similar pattern for consumer loans and credit cards, though at a more moderate pace. With a smaller net percentage of banks tightening standards, combined with banks anticipating loan demand, credit growth is poised to strengthen.
As we mentioned in the past, transitions from one economic regime to the next can be challenging. For example, economic data can present mixed signals, while the timing and magnitude of monetary or fiscal policy and how it flows through to the economy can create uncertainty and lead to volatility. Furthermore, while there are often similarities from cycle to cycle, there are unique aspects to each.
While some recent economic results imply modest economic growth and not an outright contraction, we continue to closely monitor economic data. Factors that we are monitoring are numerous but include those that typically accompany a recession such as rising unemployment, falling retail sales, declining manufacturing activity, and contracting income. For now, we maintain our year-end 2023 position that a recession is unlikely in the first half of 2024, and we continue to evaluate the possibility of a recession later in 2024 or early 2025. But the question remains whether a recession will be avoided or delayed.
Equity Markets
After a broad review of the equity markets, and a deep dive into emerging markets equities, our updated thinking on emerging-markets equities can be summarized as follows:
- China’s economy faces cyclical and structural headwinds, which we don’t believe will allow for a sustainable rally in Chinese stocks despite their historic undervaluation (China comprises roughly 25% of the MSCI EM Equity Index).
- Outside of China, the broader EM index has performed well (India, Taiwan, Brazil, etc.). At just shy of 16x trailing earnings, absolute valuations for emerging-market stocks are fairly valued, in-line with their 30-year average, no longer supporting an overweight allocation (though EM stocks remain cheap relative to US stocks).
- We acknowledge the difficulty in timing the closure of relative valuation gaps. While large relative valuation gaps between different geographic stock markets may be a reason to overweight one versus another—we believe one should also factor in absolute valuation levels for full tactical positions.
Chinese Equities
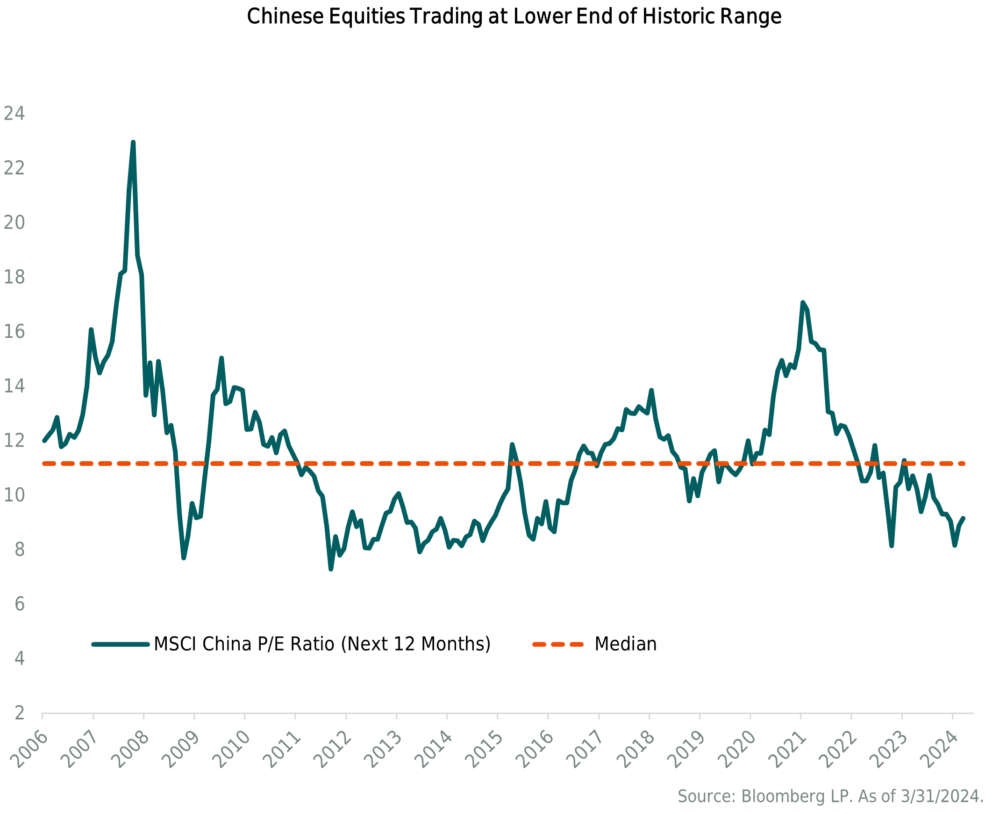
Within emerging-markets stocks, the current case for a tactical overweight to the asset class lies with China. At roughly 9x forward earnings and 11.6x trailing earnings, Chinese stocks (represented by MSCI China) trade at the lower end of their historic valuation range. While China is historically cheap, emerging markets excluding China trade rather rich to their own history. Ultimately, the combination of not being able to gain a high level of conviction in China and the overall valuation of the emerging market asset class are our primary motives for neutralizing our overweight.
Zoe Lui, a fellow at the Council on Foreign Relations, who we spoke to during our reassessment of the emerging markets, frames the structural problems facing the Chinese economy as the “Four D’s.” She contends that debt, demand, decoupling, and demographics are all hampering China’s economic growth, which will likely persist for some time. We have found this framework a useful way to understand the structural and cyclical issues at play.
Since the Great Financial Crisis, debt within the Chinese system has ballooned. And growing debt loads are increasingly straining three groups within China: households, property developers, and local governments via LGFVs (local government financial vehicles).
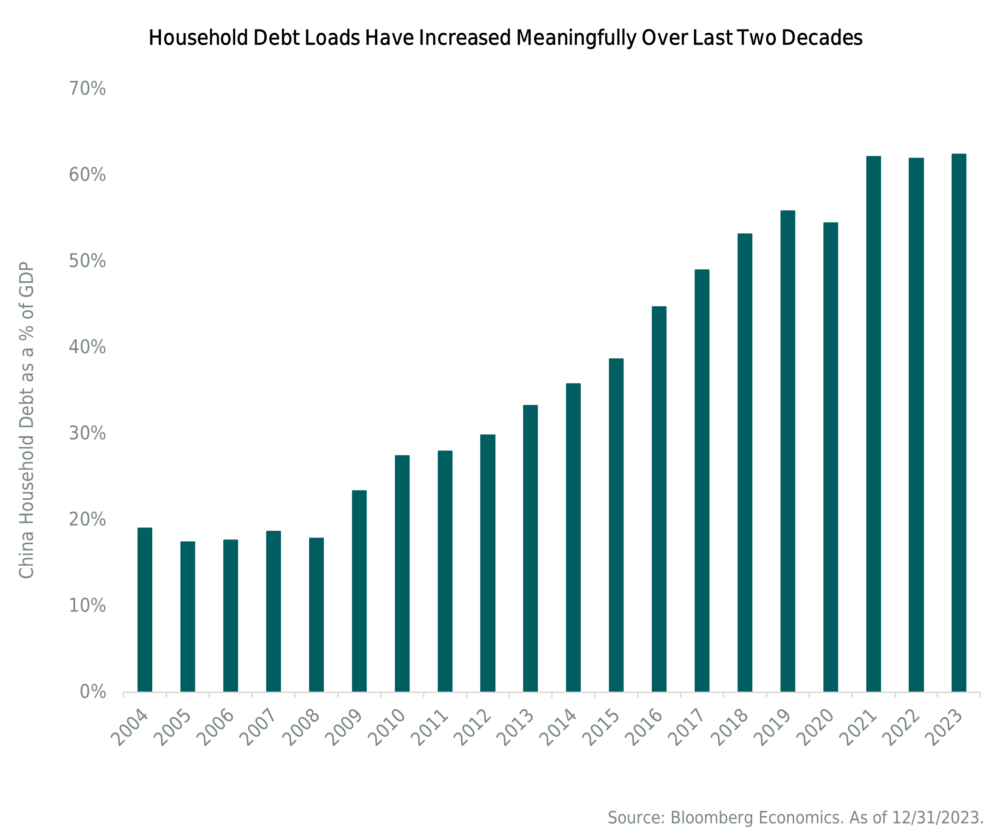
A significant portion of the Chinese population has used housing as a savings vehicle, resulting in household debt increasing to more than 60% of GDP. A high percentage of Chinese wealth is tied to their real estate holdings. And as housing prices have stagnated or decreased recently, their main asset is deteriorating in value and creating a negative wealth effect. According to data from the Bank of International Settlements, non-financial-sector debt in China has increased by nearly $40 trillion since the end of 2011. Over the same period, U.S. debt has increased by a little less than $30 trillion, while emerging markets excluding China upped their debt load by $10 trillion.
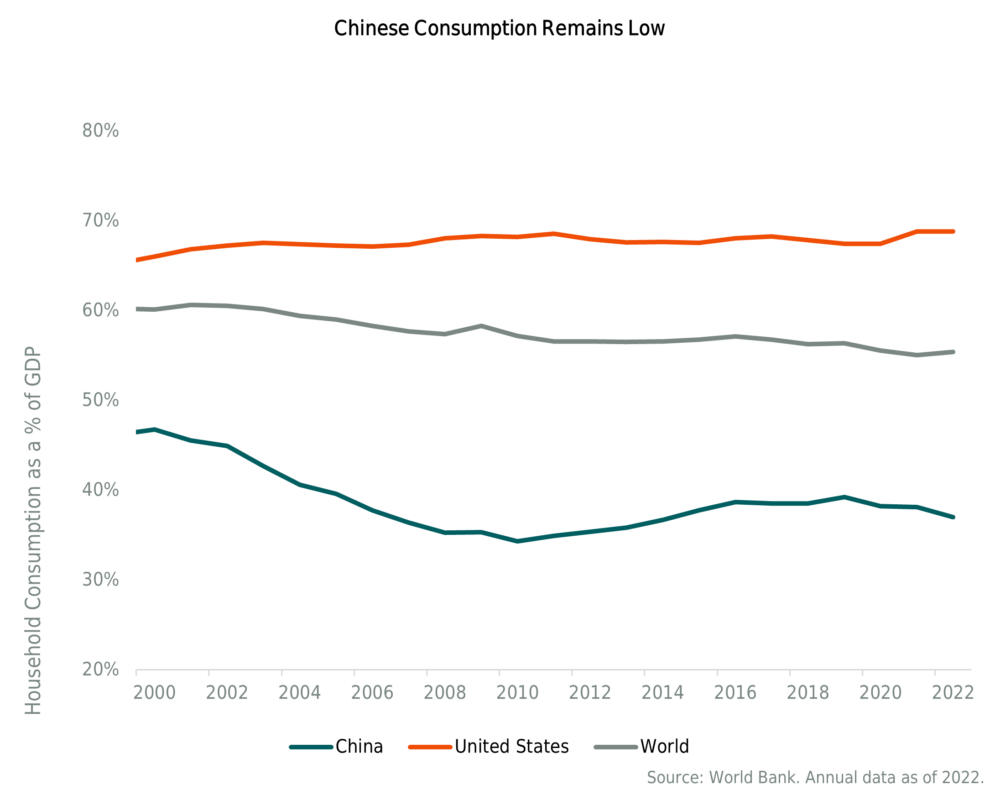
From a demand perspective, the Chinese government has long maintained the desire to transition the economy from export-led growth to a model increasingly driven by consumption and services, with less emphasis on debt-financed public investment. Chinese consumption is well below the world average and has not moved substantially despite the government’s desire (see chart below). Part of the problem has been financial repression. With most of China’s growth having come through government-directed investment, it effectively subsidizes these businesses at the expense of households. Artificially low rates needed to fund government projects take income away from households. There are no hints that the current system is going to be reversed—despite the government’s desire for economic growth to be more consumption driven. Reshaping the economy towards the consumer runs counter to a closed and controlled system.
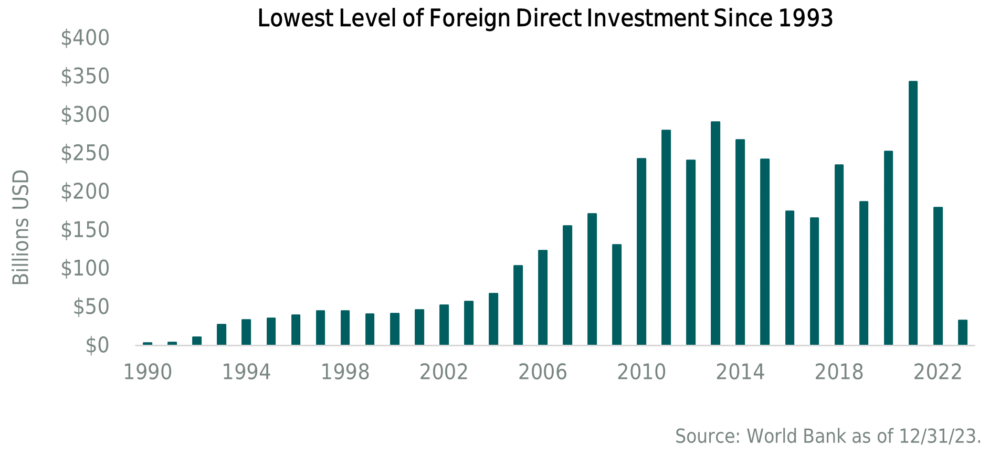
The third headwind facing the Chinese economy is the decoupling trend of recent years. Foreign direct investment into China has fallen off a cliff and was at 30-year lows last year. The trade war between China and the U.S. kicked off in 2018 under President Trump but has not eased up under President Biden. Tariffs were not rolled back under Biden—instead the pressure was turned up and targeted sanctions on next generation technology has only intensified. Taking a tough stance on China has become one of the few bipartisan issues in Washington D.C., which would likely amplify as we enter what is likely to be a contentious November election.
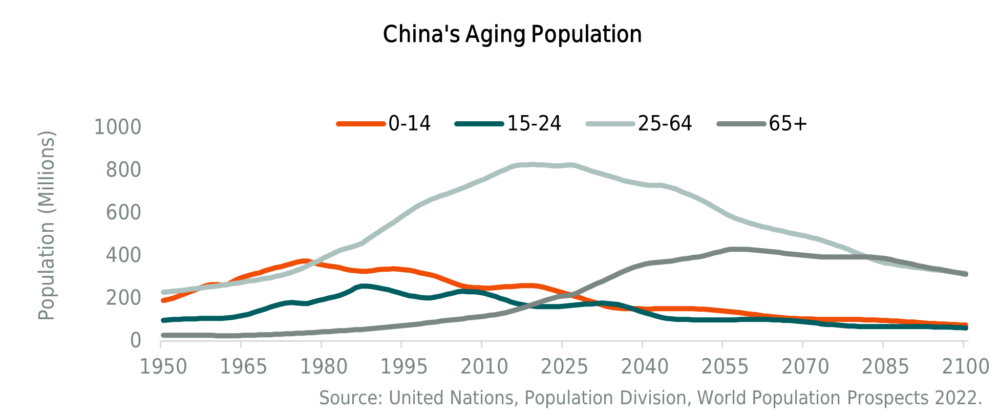
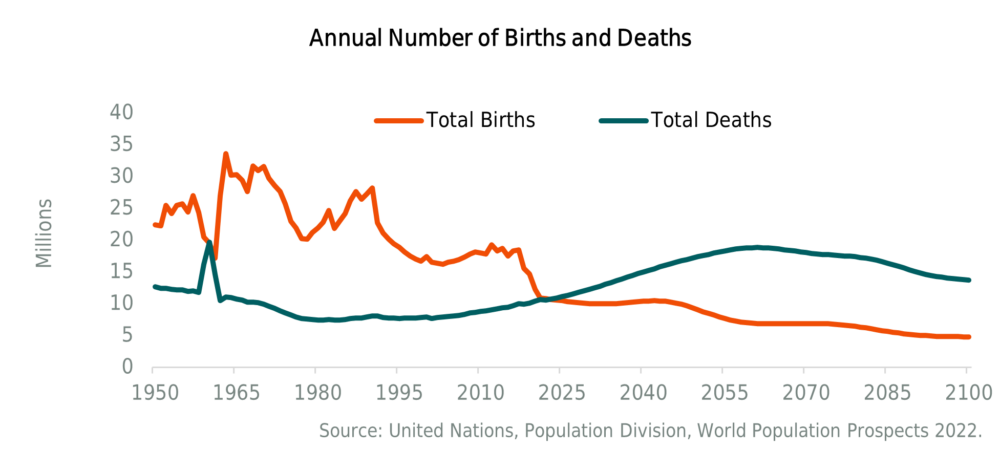
The demographic issues facing China are well known. The country no longer holds the title as the world’s most populous country—that now belongs to India. The country’s working age population has peaked based on United Nations data and the overall population has started to shrink. There is no short-term fix for their demographic problem. However, for the moment, a shortage of workers does not seem to be the issue (as evidenced by the high youth unemployment rate). Nevertheless, a shrinking population will only exasperate property issues in the future as less housing will be needed in an already oversupplied market.
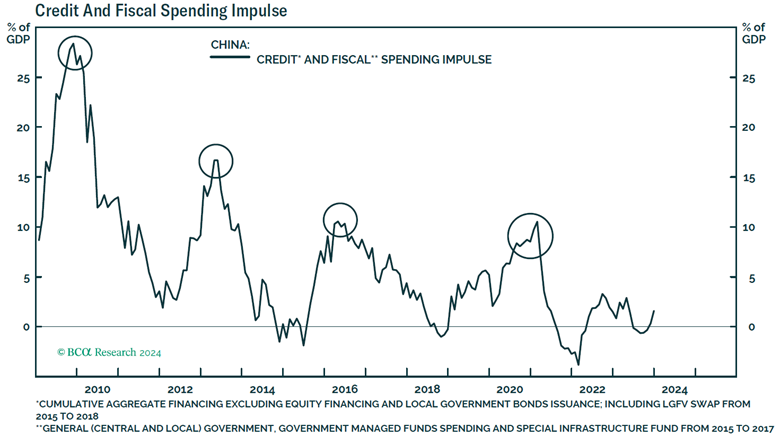
Beijing authorities are aware of these acute problems facing their economy. But the challenge they face is that the existing growth model of state-led investment has been in place for decades and makes true reforms difficult. It is evident that absent a meaningful crisis, the government has pivoted away from the property sector and is more concerned about stabilizing the sector instead of reflating it. Given this, investors shouldn’t expect the same large-scale stimulus the country has relied on in the past to come out of cyclical downturns. Any large stimulus would further worsen the imbalances the government is trying to fix.
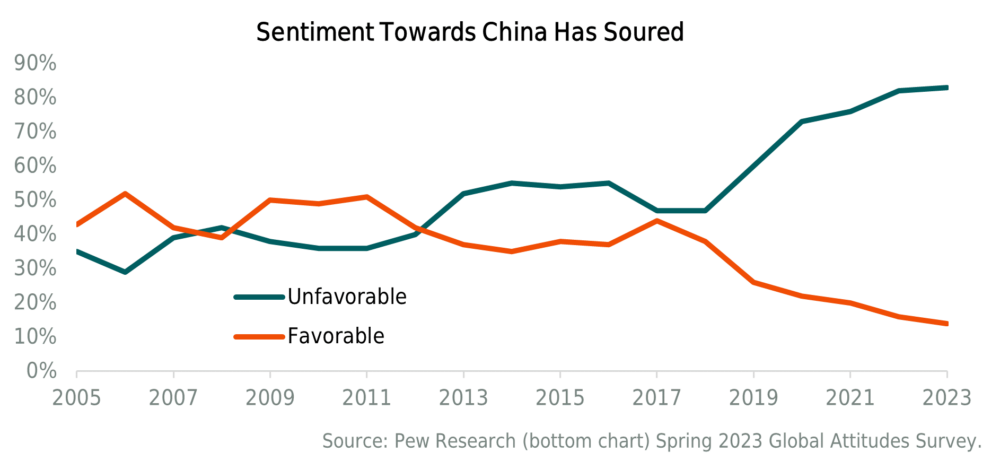
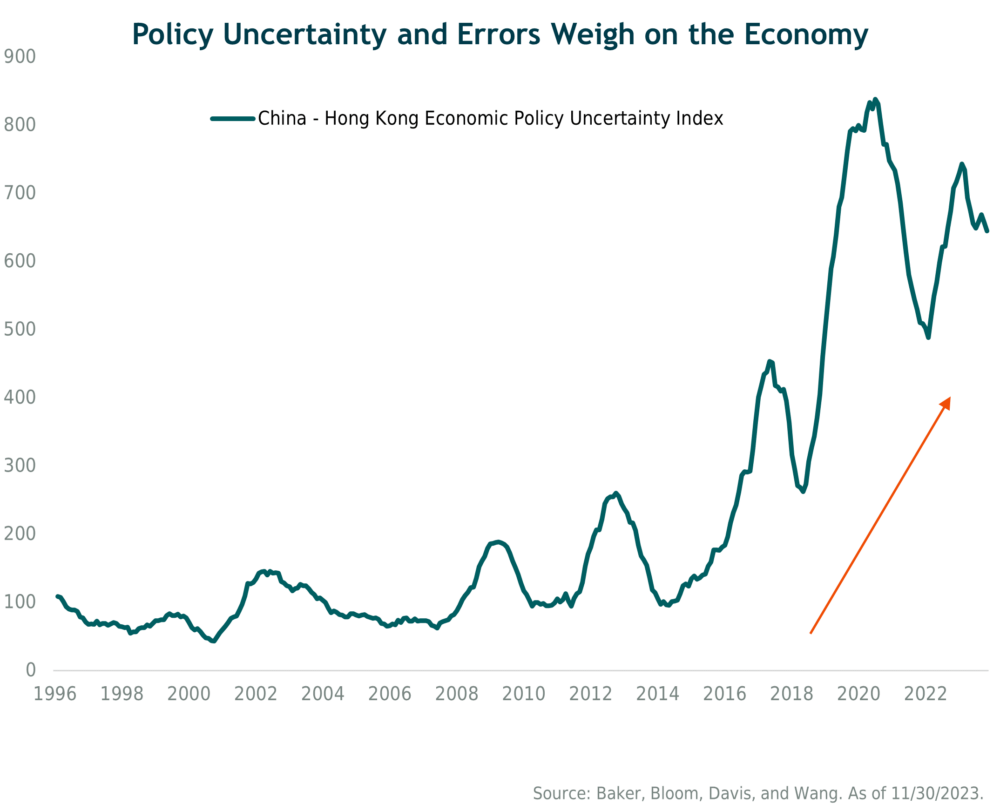
On top of these structural issues, government policy has become highly uncertain. The country’s economic policy uncertainty index has increased substantially during the course of Xi Jinping’s rule. China’s zero-COVID policy caused meaningful damage to the economy. Many governments pivoted away from overly harsh policies by 2021, however, China was obsessed with zero-COVID until late 2022. In addition to strict lockdowns, the government has cracked down on real estate, tech platform companies, after-school tutoring, and video games. The culmination of all these has further dampened economic activity.
The decision to sell a long-term tactical allocation that hasn’t worked out is never an easy one. However, given the level of cyclical and structural headwinds China’s economy faces, we lack the level of conviction we require for a “fat pitch” tactical overweight to emerging markets despite Chinese stocks’ historic undervaluation. As such, portfolios will reflect our updated views and align with our best thinking.
Emerging-Markets excluding China
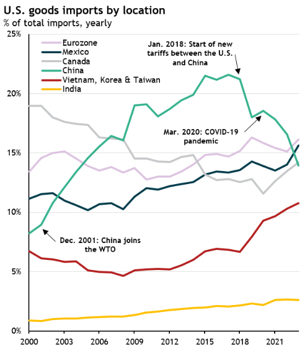
Outside of China, the longer-term outlook for emerging markets is healthier. As many countries re-direct investment away from China in an attempt to be less dependent on it, other countries stand to benefit. Besides attracting foreign investment flows, other emerging-market countries are making up a greater share of U.S. imports. Since 2018, goods imported into the U.S. from China have steadily fallen. Mexico has now overtaken China in terms of U.S. goods imports. Other emerging Asian economies such as Vietnam, Korea, and Taiwan have also picked up share.
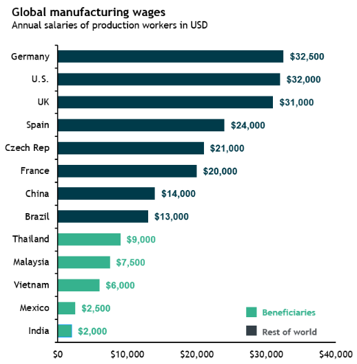
Part of the shift in goods manufacturing away from China also has to do with the fact that its manufacturing cost advantage is being chipped away. According to JP Morgan data, China’s manufacturing wages have increased as the economy has matured. While China certainly still has an advantage in terms of manufacturing capacity and efficiency, other emerging markets have a worker cost advantage.
While the fundamental outlook for emerging markets outside of China is more optimistic, investors are paying a higher-than-average valuation. Based on Ned Davis Research, the median P/E for emerging-markets ex-China since the mid-1990s has been 14.6x. Currently, this same index trades at just over 17x earnings making it overvalued relative to its own history, but not outrageously so. To us, that means the upside case for emerging-markets equities stems from the undervaluation of China. At the broad emerging-markets index level, valuations currently stand at roughly their 20-year median—around 12x forward earnings. We consider this to be a fair valuation, and we do not believe it merits a full tactical overweight position. Certainly, emerging market valuations trade at a steep discount relative to U.S. stocks, but they do not offer returns that are superior to their long-term average. We remain open to overweighing emerging-market equities in the future but will wait for above-average long-term returns when we have confidence they will normalize.
Given our assessment of China and emerging markets equities, we did a thorough review of our overall equity allocation and how we believe it should be positioned. We decided to begin trimming our allocations to emerging-market stocks so that our portfolios’ equity exposures are closer to their neutral or “strategic” allocations to U.S. large cap, U.S. small cap, developed international, and emerging-market stocks. We believe this move could marginally reduce the portfolios’ overall equity risk, as U.S. stocks would likely outperform the historically more volatile emerging markets in a downturn.
In the process of this equity market rebalancing, within any additions to U.S. large caps we are favoring value style or “quality at a reasonable price” within active management selections over those with growth style, due to the strong absolute and relative returns for growth stocks over the past year and a half. As we mentioned in our Q4 2023 commentary, we think there’s a decent probability of the market broadening out beyond the Magnificent Seven and into other segments.
U.S. Stocks
U.S. equity markets rose in the quarter as earnings growth exceeded expectations. The growth was mainly due to large-cap technology, communication services, and consumer discretionary names, a trend that has been in place since 2023. Confidence in earnings did not sour despite rising rates, which could have had a negative impact on stock valuation. Smaller-cap stocks were again not able to keep pace with larger-cap companies and remain relatively cheap. Although small-caps appear cheap relative to large-caps, our portfolios already have a smaller market-cap than the S&P 500 due to stock picking on the part of active equity managers.
We think it’s quite possible that U.S. stocks can continue to climb the wall of worry. At the same time, we fully acknowledge there are metrics to suggest some caution, mainly valuation. Looking ahead, we think equities will need better earnings growth to move much higher, as the benefit of multiple expansion may be running out of gas. We know valuation is an unreliable timing tool, and that predicting the timing and magnitude of stock market decline is difficult, if not impossible. As we consider our equity exposure, we seek to control the risks we take.
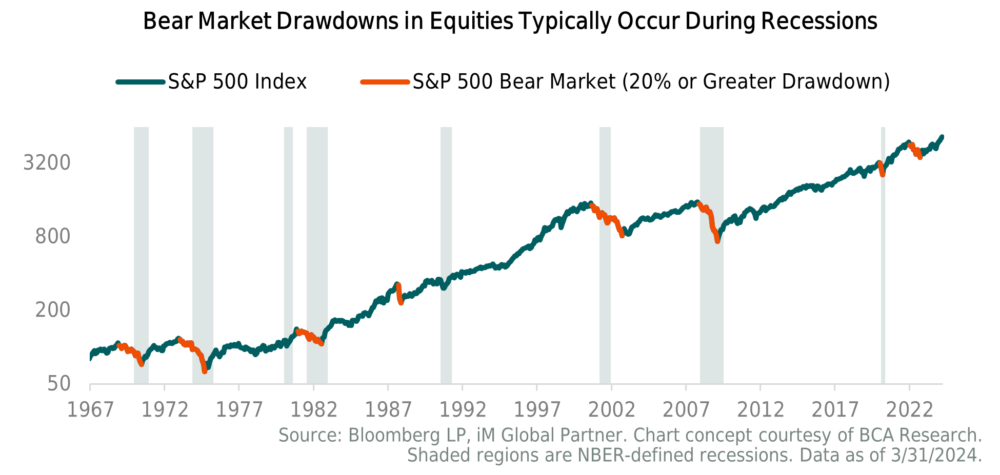
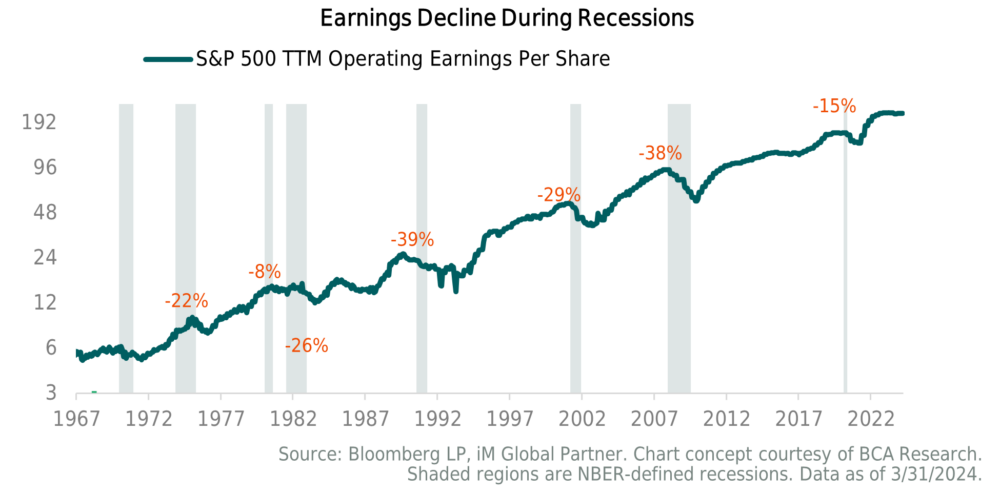
We currently maintain a neutral stance to U.S. equities given our outlook. Absent a very strong conviction that a recession is imminent, we think it’s prudent to maintain a full allocation to equities. As the chart below shows, bear market drawdowns in equities typically occur during recessions, which is when earnings take a hit. After dipping in 2022, S&P 500 earnings have recouped the levels they hit at the end of 2021. Where earnings go over the next year will have a big impact on equity returns. Should growth reflate, earnings have room to the upside and prices can grow into currently elevated valuations, and even go higher. If earnings remain at current levels, meaningful returns will be hard to come by given valuations bumping up their ceiling. If a recession occurs, equity prices could be hit with the double whammy of falling earnings and contracting multiples. Current economic data points to a reaccelerating economy so we do not feel strongly a recession is imminent. However, we are cognizant that the lag effect of the Fed’s tightening policy could still be working through the system—just with a longer lag than many anticipated.
Fixed-Income/Bond Markets
As we stated earlier, all eyes are on the Fed, especially when it comes to fixed-income. At the Fed’s late-March meeting, Chair Powell announced that the overnight federal funds rate would remain unchanged at the current range of 5.25% to 5.5%, keeping it at the highest level in over two decades. This was the fifth consecutive meeting that rates were held steady, and this outcome came as no surprise, particularly after the most recent inflation and employment data, both of which came in stronger than expected. Powell reiterated the Fed’s commitment to bringing inflation down to its 2% target. He also highlighted that inflation has eased substantially while the labor market has remained strong, which is in line with the Fed’s dual mandate of stable prices and maximum employment.
The Fed’s latest forecast is for three rate cuts over the remainder of 2024, but the timing of the cuts remains uncertain. The current consensus is that the first cut will occur in June. As we touched on above, if cuts do begin this summer, it remains to be seen whether inflation will reach the 2% target by then. In the scenario where inflation remains above 2% but the Fed still cuts, we suspect their message will be that monetary policy is sufficiently restrictive, and that rate cuts in proportion to declining inflation are simply a means to prevent policy from getting even more restrictive. We suspect the Fed would also emphasize they believe inflation will decline to the 2% long-run target over time.
We do have to consider the scenario where inflation settles in at 2.5%, not the anticipated 2.0% level. If this higher-inflation scenario occurs and the Fed has made a cut or two in the summer months, we would expect them to pause further cuts. We do not expect the Fed to start hiking rates again. Instead, we believe the central bank would leave rates at that current level, saying that by keeping policy restrictive for long enough, they can credibly forecast inflation returning to the 2% target. In this scenario, the bond market would have to recalibrate expectations and we would expect longer-term yields to increase.
In terms of fixed-income portfolio positioning, not much has changed since our year-end commentary. We believe that inflation is under control for now, and that short-term interest rates have peaked and will likely decline slightly over the course of the year. With regard to corporate bonds, we do not foresee a near-term risk of a spike in default rates given the still-attractive corporate fundamentals. In this environment we continue to take advantage of the inverted yield curve, emphasizing shorter-term higher-yielding securities with yields in the 6.5% to 7% range, while also maintaining some exposure to longer-term bonds with yields in the 4.5% to 5%, which can also provide protection in the event of a stock-market downturn. We do have some exposure to below-investment-grade securities. While the yield spreads in this space are below average at 7.5% and appear expensive, the portfolio exposure we have is higher-quality with shorter-term maturities than the high-yield market and we are only giving up incremental yield. We think we are being appropriately compensated for this targeted exposure.
As we look ahead, we will be on the lookout for any opportunities that arise. A specific opportunity we are monitoring is longer-term interest rates. At the end of the quarter, the 10-year Treasury was yielding 4.2%. If we see a meaningful increase in these yields or those of investment-grade core bonds, it is likely that we would increase exposure to high-quality, interest-rate sensitive securities to capture attractive yields and provide more ballast to the portfolios.
Alternatives
Trend Following Managed Futures (SG Trend Index) got off to a strong start in the first quarter, gaining 12.2%, keeping pace with the S&P 500 Index (+10.6%) and handily beating the Bloomberg Aggregate Bond Index (-0.8%). The strong start to the year demonstrated that managed futures strategies aren’t just an insurance policy against stock and bond market declines but can actually produce attractive returns in different market environments. Investors are more familiar with managed futures outperforming equity markets during significant downturns. This is also true in relation to fixed-income, as managed futures performed very well relative to core bonds in the carnage of 2022 but is a less common experience since core bonds have rarely suffered losses of that magnitude. We continue to believe Managed Futures are an excellent diversifier given their potential to deliver uncorrelated returns outside of traditional asset classes/asset allocation.
Conclusion
The stock market continues to hit new highs as economic growth continues to benefit corporate revenues and earnings. However, stock market concentration in the U.S. remains elevated with the Magnificent Seven representing over 25% of the S&P 500. With such a narrow focus on a small number of higher-valuation stocks and in one theme in particular (Artificial Intelligence), this carries risks. There’s no doubt that the other 493 stocks of the S&P 500 have struggled on a relative basis, but they could be set to move higher if the key economic drivers outlined above continue to fuel the economy.
The U.S. economy currently appears to be in in decent shape. That said, fears of a recession haven’t completely abated. But our near-term view is that the U.S. will avoid a sharp downturn due to its still-strong strong labor market, strength in consumer spending, and elevated corporate earnings. Looking out to the end of the year and into next year, the question remains whether a recession will be avoided or delayed.
As we look ahead, we anticipate there will be pockets of choppiness given headline risks related to Fed policy, geopolitical events such as the ongoing wars in Europe and the Middle East, and the upcoming U.S. presidential election (election years have historically been more volatile for the equity markets). In the event of volatility, we will look to be opportunistic, taking advantage of any attractively priced and balanced risk/reward opportunities that arise.
We thank you for your continued confidence and trust.
Important Disclosure
This report is solely for informational purposes and shall not constitute an offer to sell or the solicitation to buy securities. The opinions expressed herein represent the current views of the author(s) at the time of publication and are provided for limited purposes, are not definitive investment advice, and should not be relied on as such.
The information presented in this report has been developed internally and/or obtained from sources believed to be reliable; however, Litman Gregory Wealth Management, LLC (“Litman Gregory” or “LGWM”) does not guarantee the accuracy, adequacy or completeness of such information. Predictions, opinions, and other information contained in this article are subject to change continually and without notice of any kind and may no longer be true after the date indicated.
Any forward-looking statements speak only as of the date they are made, and LGWM assumes no duty to and does not undertake to update forward-looking statements. Forward-looking statements are subject to numerous assumptions, risks and uncertainties, which change over time. Actual results could differ materially from those anticipated in forward-looking statements.
In particular, target returns are based on LGWM’s historical data regarding asset class and strategy. There is no guarantee that targeted returns will be realized or achieved or that an investment strategy will be successful. Target returns and/or projected returns are hypothetical in nature and are shown for illustrative, informational purposes only. This material is not intended to forecast or predict future events, but rather to indicate the investment returns Litman Gregory has observed in the market generally. It does not reflect the actual or expected returns of any specific investment strategy and does not guarantee future results. Litman Gregory considers a number of factors, including, for example, observed and historical market returns relevant to the applicable investments, projected cash flows, projected future valuations of target assets and businesses, relevant other market dynamics (including interest rate and currency markets), anticipated contingencies, and regulatory issues. Certain of the assumptions have been made for modeling purposes and are unlikely to be realized. No representation or warranty is made as to the reasonableness of the assumptions made or that all assumptions used in calculating the target returns and/or projected returns have been stated or fully considered. Changes in the assumptions may have a material impact on the target returns and/or projected returns presented.
A list of all recommendations made by LGWM within the immediately preceding one year is available upon request at no charge. For additional information about LGWM, please consult the Firm’s Form ADV disclosure documents, the most recent versions of which are available on the SEC’s Investment Adviser Public Disclosure website (adviserinfo.sec.gov) and may otherwise be made available upon written request to compliance@lgam.com
LGWM is an SEC registered investment adviser with its principal place of business in the state of California. LGWM and its representatives are in compliance with the current registration and notice filing requirements imposed upon registered investment advisers by those states in which LGWM maintains clients. LGWM may only transact business in those states in which it is noticed filed or qualifies for an exemption or exclusion from notice filing requirements. Any subsequent, direct communication by LGWM with a prospective client shall be conducted by a representative that is either registered or qualifies for an exemption or exclusion from registration in the state where the prospective client resides.
Index Disclosure
Any reference to a market index is included for illustrative purposes only, as it is not possible to directly invest in an index. Indices are unmanaged, hypothetical vehicles that serve as market indicators and do not account for the deduction of management fees or transaction costs generally associated with investable products, which otherwise have the effect of reducing the performance of an actual investment portfolio.
The Standard & Poor’s 500 Composite Stock Price Index is a capitalization-weighted index of 500 stocks intended to be a representative sample of leading companies in leading industries within the U.S. economy. Stocks in the Index are chosen for market size, liquidity, and industry group representation.
The Russell 2000 Index measures the performance of the small-cap segment of the US equity universe. The Russell 2000 Index is a subset of the Russell 3000® Index representing approximately 7% of the total market capitalization of that index, as of the most recent reconstitution. It includes approximately 2,000 of the smallest securities based on a combination of their market cap and current index membership.
The MSCI ACWI Index represents the performance of large- and mid-cap stocks across 23 developed and 24 emerging markets. The index covers 2,900 constituents across 11 sectors and approximately 85% of the free float-adjusted market capitalization in each market.
The MSCI EAFE Index is an equity index which captures large and mid-cap representation across 21 Developed Markets countries* around the world, excluding the US and Canada. With 799 constituents, the index covers approximately 85% of the free float- adjusted market capitalization in each country.
The MSCI Emerging Markets Index is a free float-adjusted market capitalization index that is designed to measure equity market performance of emerging markets. The MSCI Emerging Markets Index consists of the following 23 emerging market country indexes: Brazil, Chile, China, Colombia, Czech Republic, Egypt, Greece, Hungary, India, Indonesia, Korea, Malaysia, Mexico, Peru, Philippines, Poland, Qatar, Russia, South Africa, Taiwan, Thailand, Turkey and the United Arab Emirates.
The Bloomberg U.S. Aggregate Bond Index is a broad-based benchmark that measures the investment grade, U.S. dollar- denominated, fixed-rate taxable bond market.
The US High-Yield Market Index is a US Dollar-denominated index which measures the performance of high-yield debt issued by corporations domiciled in the US or Canada.
The ICE BofA US High Yield Index is market capitalization weighted and is designed to measure the performance of U.S. dollar denominated below investment grade (commonly referred to as “junk”) corporate debt publicly issued in the U.S. domestic market.
The ICE U.S. Dollar Index is a geometrically-averaged calculation of six currencies weighted against the U.S. dollar.
The S&P/LSTA Leveraged Loan 100 Index (LL100) dates back to 2002 and is a daily tradable index for the U.S. market that seeks to mirror the market-weighted performance of the largest institutional leveraged loans, as determined by criteria. Its ticker on Bloomberg is SPBDLLB.
The MSCI Hedged Indexes include all of the securities and weights of each corresponding unhedged MSCI Parent Index, enabling investors to measure the impact of hedging currency, for all the constituents of the Parent Index.
MSCI World ex USA Index: captures large and mid cap representation across 22 of 23 Developed Markets (DM) countries*–excluding the United States. With 871 constituents, the index covers approximately 85% of the free float-adjusted market capitalization in each country.
Estimated Returns Disclosure
Scenario Definitions:
Downside: The economy falls into a deep and sustained recession for any of various reasons, such as deleveraging/deflation, unexpected systemic shock, geopolitical conflict, Fed or fiscal policy error, etc. At the end of our five-year tactical horizon, S&P 500 earnings are below their normalized trend and valuation multiples are below-average reflecting investor risk aversion. Inflation and 10-year Treasury nominal and real yields are very depressed.
Base: Consistent with long-term economic and market history, reflecting economic and earnings growth cycles that are interspersed with recessions around an upward sloping normalized growth trendline. Inflation is at or moderately higher than the Fed’s 2% target level and 10-year Treasury real yields are around zero percent to slightly positive. For the S&P 500, we now bookend our base case with a lower-end and upper-end estimate:
-
At the lower end of our base-case fair-value range, reflation efforts are successful and nominal economic growth is higher than the average. However, the economy overheats, and valuation multiple and some margin compression largely offset the favorable macro backdrop.
-
At the upper end, reflation efforts are also successful, nominal economic growth is higher than observed since the 2008 financial crisis on average, profit margins move slightly higher, and valuation multiples are also slightly higher than the recent historical average.
Upside: S&P 500 earnings end the period well above their long-term (base case) normalized trendline. Valuation multiples are well above average and higher than the upper end of our base case. The Fed exits its accommodative policy without major economic or market disruptions, although a normal recession within the five-year period is still possible. Inflation is around or moderately higher than the Fed’s 2% average target. Real 10-year Treasury yields are around zero percent to negative as the Fed succeeds in keeping rates from materially rising.
What the Table Shows: Our five-year, annualized asset class return estimates under several broad economic scenarios. Collectively, the scenarios we use encompass the range of outcomes we believe are reasonably possible and therefore worth considering in creating our portfolio allocations.
Why We Use Scenarios: Considering how each asset class might react under a consistent set of scenarios allows us to calibrate our return expectations across asset classes. We believe this helps us make better asset allocation decisions.
These Scenarios Can Change: As the overall economic environment changes it will at some point necessitate changes to the scenarios we consider. Therefore, there could be times when we are reassessing scenarios and temporarily suspend providing updates for one or more scenarios. When this happens, we will clearly note it and give guidance on when we expect to complete this process.
Any projections provided regarding the likelihood of various investment outcomes are hypothetical in nature, do not reflect actual investment results and are not guarantees of future results. Investing involves risk, including the potential loss of principal, and investors should be guided accordingly.