All Eyes – Including Ours – Are on Inflation
Rising consumer prices are one of the many unwelcome consequences of the COVID-19 pandemic, and inflationary fears have become a reliable topic for the investment news media. We’ve discussed inflation at length in recent investment commentaries but given its importance we wanted to address the topic again and provide an updated review. Our focus here is not on sharing deep analysis of inflationary pressures, but rather to share our high-level views and reasoning on how inflation might play out in the quarters and years ahead and how we’re factoring that into our investment positioning.
Early in the pandemic the sharp decline in economic activity was deflationary, but those forces have now rolled off the year-over-year numbers. Meanwhile the sharp rebound in economic activity combined with supply chain disruptions and labor shortages have led to the highest inflation readings in the U.S. in thirty years.
A shorter-term spike in inflation can hurt certain areas of the stock and bond markets while being friendlier to others. But we are long-term investors in part because we have more confidence in our ability to assess the long-term fundamental trends than we can the short-term market zigs and zags. So, the big question for us is the degree to which the forces driving higher inflation are temporary versus likely to be sustained for the longer term.
We have expressed our belief that a good portion of current inflation readings are a temporary result of the economic disruption caused by the pandemic. This notably includes supply chain problems (e.g., factories in Asia closed due to the pandemic) and the difficulty in getting workers (e.g., truckers to transport containers offloaded in Los Angeles ports). In addition to these supply-side impacts, the pandemic has also led to a sharp spike on the demand side for consumer goods (e.g., home improvement products, exercise equipment, cars). It is econ 101 that when supply contracts and demand expands, prices rise. This is what we’ve seen.
What it also means is that these pandemic-related inflationary forces can be expected to ebb in the quarters ahead and return toward more normal historical levels as these forces subside (supply chains normalize, more people feel the need and confidence to return to work, and consumer demand reverts to a more normal mix between goods and services).
But there are two caveats to this.
First, as we’ve noted, this view assumes ongoing global progress against the pandemic as our base case. Unfortunately, we can’t rule out another severe pandemic-related economic disruption—for example, from a new highly contagious and deadly variant. Now we have Omicron. The coming weeks will tell us more, but at this point it appears Omicron may be more transmissible thanks to mutations that reduce immunity, but it does not appear any more dangerous than prior strains (and possibly is less so). We will require more information before determining whether Omicron impacts our thinking on inflation (and the macroeconomic backdrop more broadly), but at this point we can say it seems unlikely Omicron by itself will materially change our long-term view on inflation.
We have also said that while we expect the inflationary forces brought on by COVID-19 to ease, we also believe we are likely to see higher inflation in the years ahead than we saw in the decade before the pandemic. It is helpful to remember that the inflationary environment in the years leading up to COVID-19 was extraordinarily benign. In other words, we’d have expected to see inflation gradually increase even without the impact of the pandemic. In fact, in our long-term view (independent of COVID-19) we believe that TIPS, which are inflation-linked Treasury bonds, play an important role in many of our long-term “strategic” portfolio allocations, as they provide dedicated protection against inflation.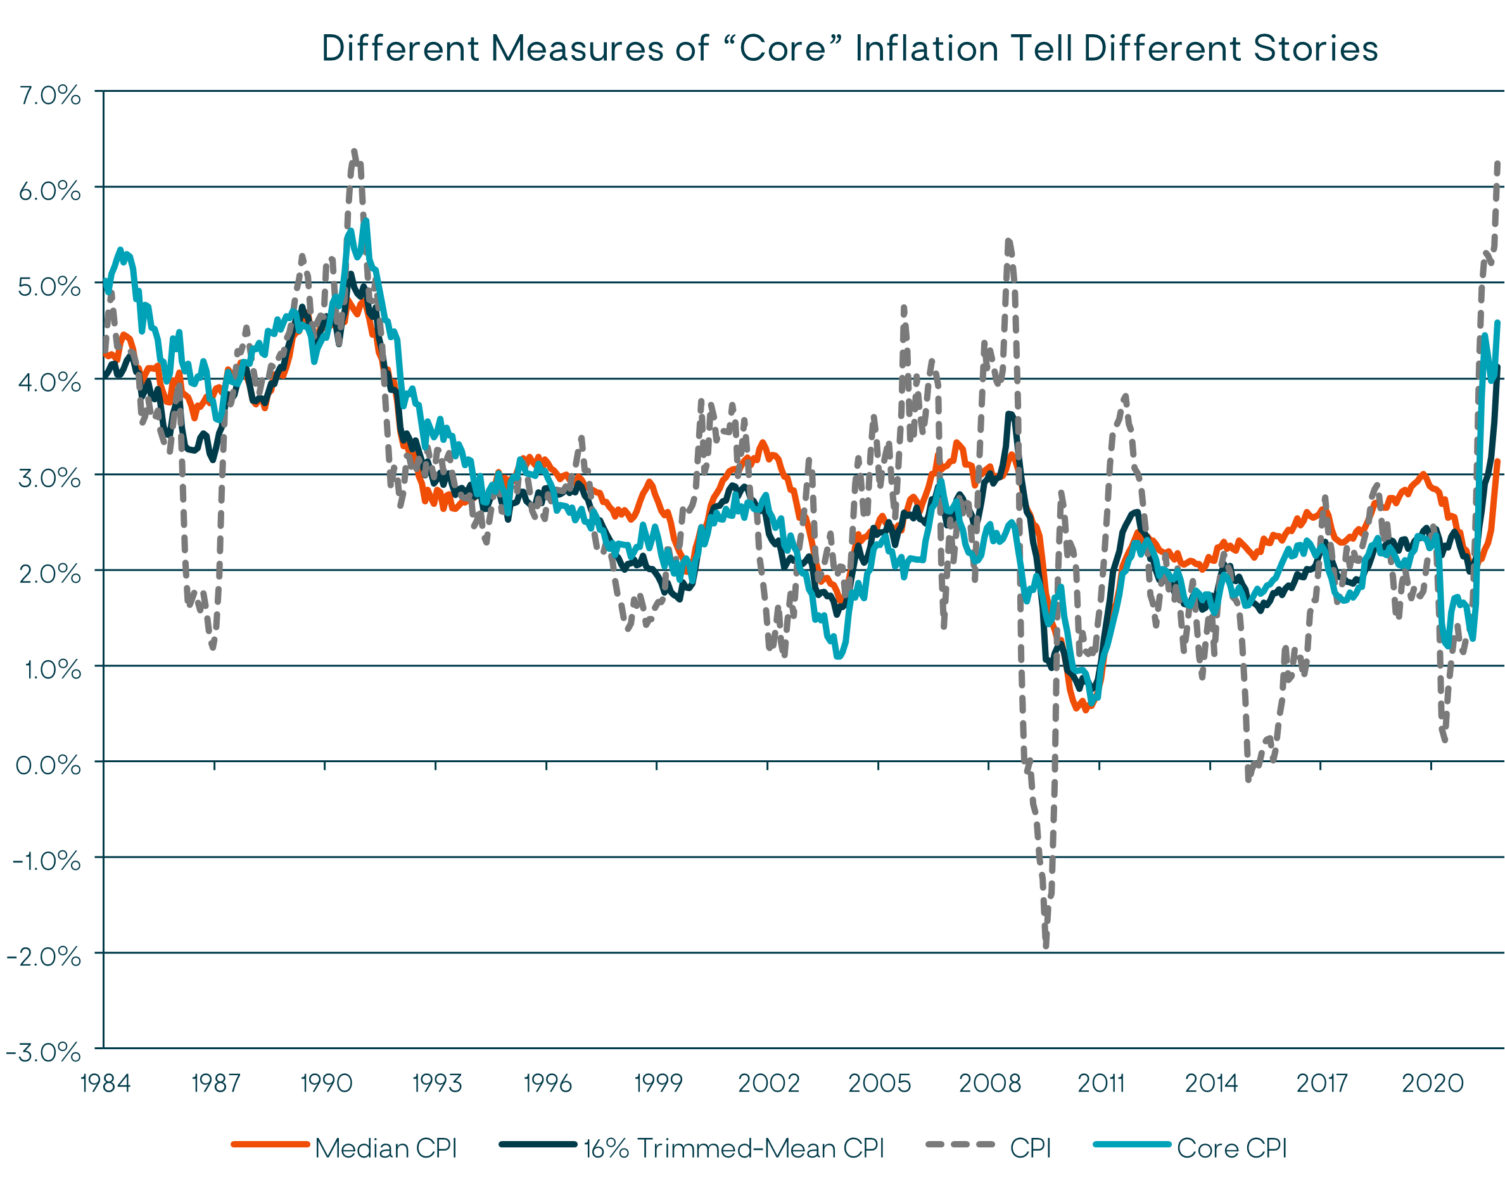
Without teasing apart all the contributing factors, it is clear that inflation is in fact a growing concern. The accompanying chart shows that on a year-over-year basis, headline Consumer Price Inflation (CPI) increased 6.2% in October. Core CPI (excluding food and energy prices) rose 4.2%, year-over-year. Median CPI, which the Federal Reserve also closely watches, increased 3.1% year over year, while the Trimmed-Mean CPI, which excludes CPI components with the most extreme monthly changes, rose 4.1%, the most since July 1991. These latter two measures exclude inflation outliers and indicate a broad-based increase in consumer prices.
One very important component of consumer inflation is Shelter. It accounts for about one-third of headline CPI and nearly 40% of core CPI. Shelter comprises two components: (1) rent prices paid by renters, and (2) “owners’ equivalent rent,” which is what homeowners say they would charge if they were renting their home. Shelter prices overall rose 3.5% year-over-year in October. And with national home prices surging, we expect to see that continue to flow through into higher shelter prices in the months ahead. (Shelter price inflation reflects home price inflation with a lag.)
What the core inflation measures are telling us is that price increases have spread out across more categories, and inflation is not being driven by just a few outliers anymore (such as car prices, which were clearly impacted heavily by supply-side disruptions).
Where does that leave us? On one side we have inflationary forces that we have good reason to expect to ease, while other measures show inflation that is both increasing and broadening. At the risk of getting technical, we will share the reasons we aren’t highly concerned about the recent high inflation rates being sustained in the years ahead.
Beyond the broad core inflation readings, everyone, including the Fed, is focused on two other inflation indicators: (1) wage inflation and (2) inflation expectations. These indicators are also moving higher (see the next two charts) but are still not signaling a high risk of sustained high inflation.
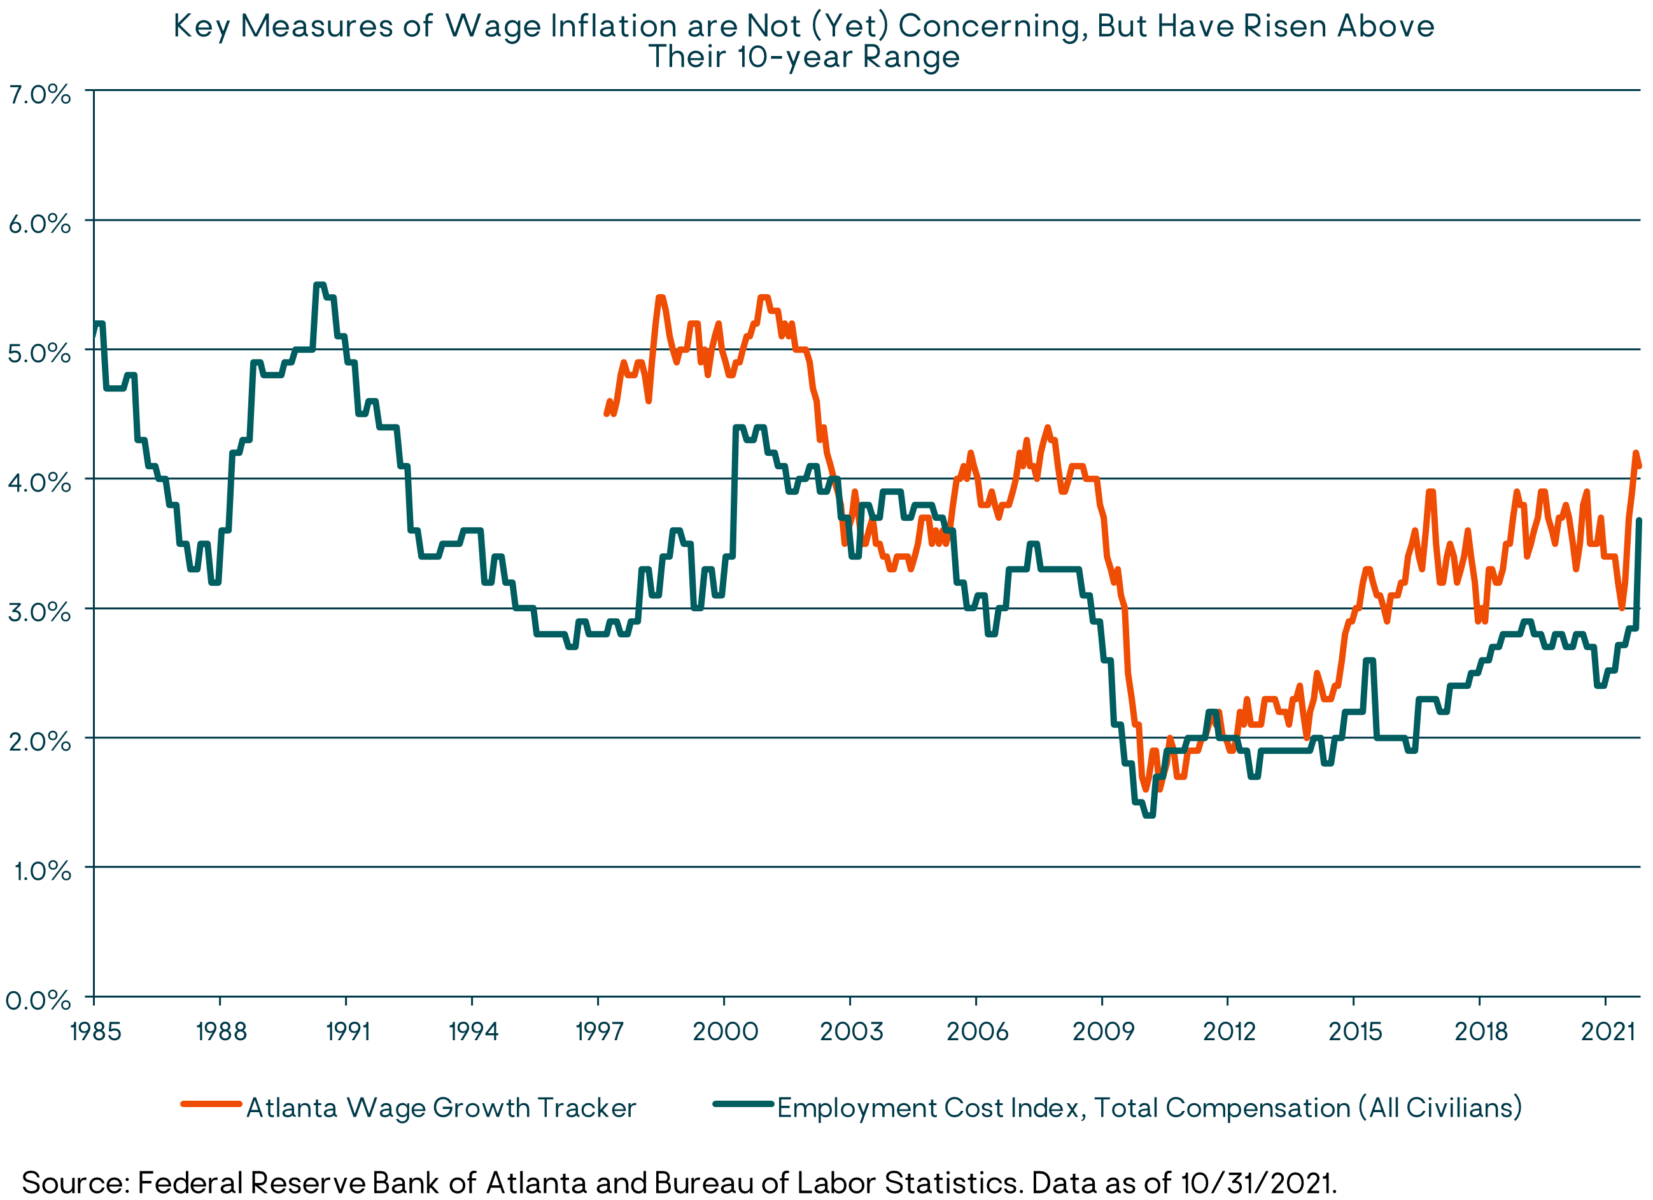
With regard to wages, this chart shows that key measures of wage inflation have increased over the past several months, but still remain within a normal historical range.
With respect to inflation expectations, the Fed follows a metric called the “5-year/5-year” – a measure of the expected headline CPI inflation rate for the five-year period starting five years from now (the inflation rate for years 2026 through 2030). This is a market-derived inflation expectations calculation based on Treasury and TIPS bond yields. It has moved up recently, but it is still in a range that the Fed is comfortable with and that is consistent with their 2% core inflation target.
Another inflation-expectations measure the Fed pays a lot of attention to is the Index of Common Inflation Expectations (CIE) – see the following chart. It is a composite of 21 market and survey-based measures of expected inflation. The Fed believes the CIE index effectively captures the general trajectory of long-term inflation expectations. It is also not in a red alert zone. The CIE is updated quarterly, and the September 30 number was 2.06% compared to 2.05% at the end of June.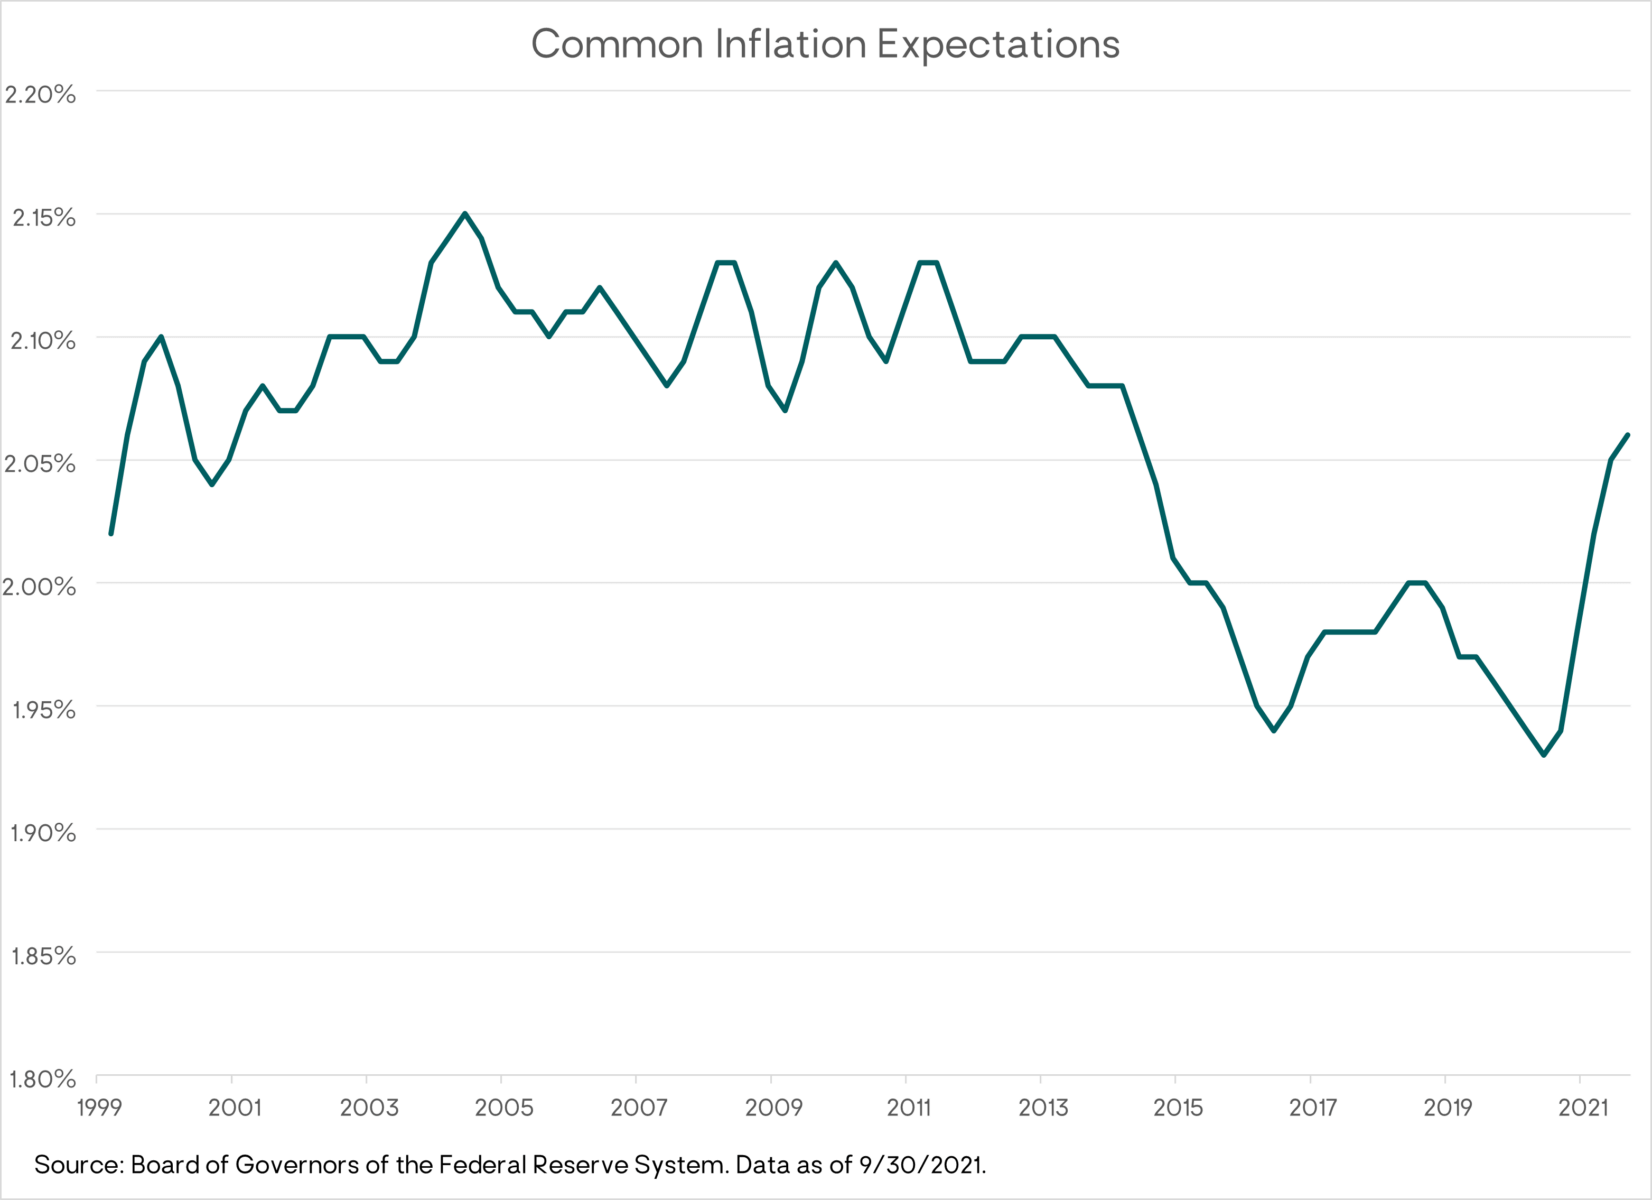
Putting it all together, we’d say the inflation data are pointing to continued inflation pressure over the next few quarters at least. But our base-case view is that the recent 4%–5%-6% CPI inflation readings are driven by mostly transitory, pandemic-related supply and demand factors. The economy still appears to have meaningful slack and excess capacity as indicated by the labor market still being several million jobs below its pre-pandemic level (when core inflation was also below 2%).
However, given the Fed’s new inflation targeting approach (which uses average inflation over longer periods), inflation readings may remain above 2% on a more sustained basis going forward than we saw over the past 10 years. Our strategic and tactical portfolio allocations take into account an expectation for higher inflation (and, likewise, higher interest rates) over the coming decade than what we’ve seen over the past decade. But they do not contain more aggressive hedges against a sharp and sustained spike in inflation in the near term.
A key reason we don’t see the need for an aggressive inflation hedge is that we don’t see evidence of the type of self-reinforcing wage-price spiral necessary to generate sustained high inflation rates, as was the case in the 1970s for example. But there are crosscurrents in the recent data, and our eyes will remain on inflation and our views will continue to evolve with the data.
–Litman Gregory Investment Team