Research Update: Drivers of Equity Returns Likely to Shift Going Forward
Predicting stock market returns is famously difficult, with so many variables – many beyond anyone’s control – combining in unpredictable ways to humble even the most knowledgeable experts at times. Bonds, to those with even a passing knowledge of how their math works, seem easier to analyze with confidence given their more predictable cash flows and reactions to interest-rate changes. While bonds may seem more “mathematical” in how their returns are generated, stocks are nonetheless governed by three factors that in fact are also quite straightforward.
Equities derive their gains (or losses) from dividends, growth in earnings per share, and fluctuations in valuation. How these three interplay over time can be difficult to predict, but we can identify obvious headwinds and tailwinds for each that stem from the broader macroeconomic environment. Unpredictable shocks like the pandemic or Russia’s invasion of Ukraine can throw wrenches into the engine of the global economy, but once those effects become clear we can factor them into the longer-term equity return assumptions that influence our portfolio asset-allocation decisions.
We’ll give a quick refresher on how each return driver works, and then look more closely at how the changes to the overall global economic environment influence our expectations going forward versus what they were in the prior period beginning after the 2008-09 financial crisis.
Dividends are the payments a public company distributes to its shareholders from the profits that it earns. Some (usually rapidly growing) companies opt not to pay much, if any, of their earnings in dividends based on management’s belief that reinvesting those cash flows into the business to drive further profit growth can generate higher long-term returns for shareholders.
Earnings growth and valuation changes are related. Valuation, measured as the price-to-earnings multiple (P/E) reflects how much investors are willing to pay for a share of a company’s stock per unit of earnings. If a company earns profits of $1 per share and the share price is $20, the P/E multiple is 20x. The idea of what investors are willing to pay for a dollar of earnings is a useful framework. If a company’s earnings grow from $1 to $1.50 per share, and the P/E multiple remains at 20x, a company’s stock price would increase from $20 per share to $30 per share. This is how earnings growth contributes to rising stock prices (and it works in reverse, of course).
When it comes to valuations, however, investors are typically willing to pay more for a dollar of current earnings if they expect future earnings to be higher. And if investors perceive a risk to future earnings – from business challenges like increased competition or a declining industry, for example – they may pay a lower P/E multiple for that company. An example of this would be a company that manages to increase current earnings from $1 to $1.50 despite a dim outlook for future growth, and as a result the share price remains at $20. In this case, the P/E multiple would contract from 20x to 13.3x. Investor expectations about future earnings are the reason why earnings growth and valuation changes can be highly interconnected.
Back to the drivers of return: if investors are willing to pay more for a dollar of earnings in the future than they are today (e.g. P/E multiples expand) then stock prices will increase even if earnings remain flat. Though in truth a likely driver of investors’ willingness to pay more is positive expectations about earnings, and so the two can reinforce one another.
That said, positive earnings expectations aren’t the only reason investors might pay more for a dollar of earnings. At the broader economic level, interest rates and risk perceptions are drivers as well. When rates are lower, stocks have less competition from generally safer investments like bonds, and investors are typically willing to pay more for a dollar of earnings from stocks. On the other hand, if investors become risk averse, as they were through the 2008-09 financial crisis or the onset of the pandemic, their fear in owning stocks is expressed in the form of lower valuations and P/E multiples contract.
If you think of a dollar of earnings as a product you buy, it makes clear the timeless investment adage (from Warren Buffett and others) that stocks are the rare product that people hate when they’re on sale and love when they’re most expensive.
The Interest-Rate Environment Has a Big Influence on Equity Returns
Looking backward, the biggest driver of equity returns during the ultra-low interest rate and inflation regime during the decade from the start of 2014 through the end of 2023 was earnings growth, which accounted for a little more than half of the S&P 500’s approximately 12% annualized gain during the decade. Earnings per share nearly doubled over that period, or just shy of 7% annualized.
Meanwhile 12-month trailing P/E multiple climbed from 18.5x to 26.8x during the same span (meaning investors went from paying $18.50 per share for each $1 of the index’s earnings to $26.80). This accounted for roughly a quarter of the S&P 500’s 10-year gain. Dividends contributed roughly 15% to returns (multiplication effects among the three make up the remainder) History shows, however, that valuation changes tend to have less impact over longer periods, suggesting this period may have been anomalous. The chart below shows the contribution of each return driver by decade going back to the 1930s. Dividends by definition are always a positive contributor but the magnitude has varied widely, and earnings growth has been positive every decade except the 1930s. Valuations, meanwhile, have both contributed and detracted meaningfully in past decades.
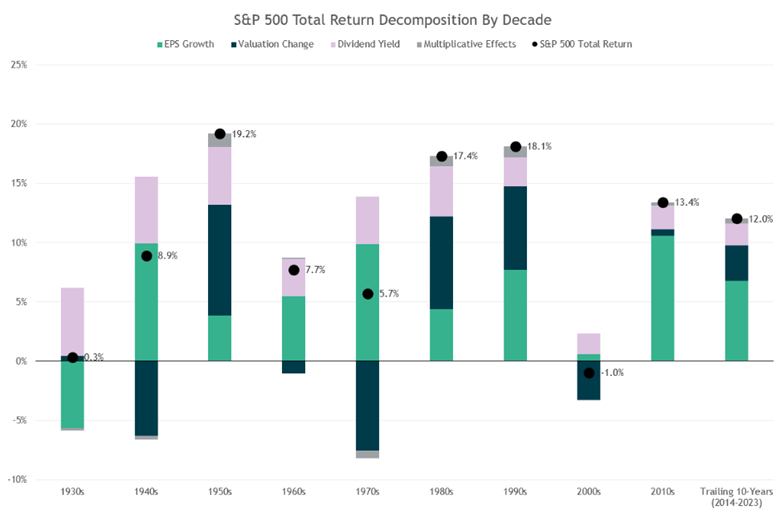
Source: Ned Davis Research
Looking again at the past decade, the historically ultra-low interest-rate environment not only decreased competition to equities from safer investments like bonds (which helps justify higher valuations) but it also contributed to profitability and earnings growth because access to cheap capital reduces companies’ borrowing costs and encourages growth-oriented capital expenditures.
Looking forward, the inverse to points we’ve made about interest rates become more important given that we are now in a meaningfully higher rate environment than most of the past decade. The headwind to valuations from higher interest rates comes in the form of increased competition from lower-risk fixed-income investments that now boast higher yields, and because a common methodology of analysts who determine what they’re willing to pay for a stock is based on the present value of future cash flows. A higher interest rate in that calculation results in a lower valuation for the same level of future earnings.
Looking ahead we don’t expect P/E multiples to contribute to returns as they have in the past year or in past decades. With P/E multiples nearing 25x, valuations are elevated relative to history, and if one assumes inflation of 3%, history suggests a P/E of around 17x is appropriate. Therefore, in our base case we expect a mild contraction of valuations creating a modest headwind to equity returns, and flat P/Es (meaning valuations don’t change) would be a positive outcome in our view.
That leaves us with two horses to pull the return cart down the track: earnings growth and dividends. Dividends are even lower now than just over a decade ago at the beginning of 2013. The S&P 500 currently has a dividend yield in the neighborhood of 1.4% versus close to 2% a decade earlier. And for dividend yields to contribute more to returns would require an offsetting decline in valuations (which pushes dividend yields higher) so all we in aren’t likely to see much contribution from dividends.
That all said, if most of your return is going to come from a single horse, earnings growth is the horse you want. Over the long term, earnings growth has been about 6% and has been the largest driver of equity returns. After a lull in 2022, earnings growth picked back up last year – as the most anticipated recession ever did not materialize – to reach all-time highs, as the chart below shows. The big question looking forward is whether earnings will continue to accelerate in the near term amidst a “goldilocks” economic scenario (not too strong or too weak) or if the economy slows. Over the longer-term, which is the basis for our investment decisions, we think earnings could grow in the mid-single-digit range, with overall equity returns in the same range given the contribution from dividends being offset by valuations pulling back a bit. A more-optimistic scenario is also plausible with equity returns reaching high single- or low double-digit levels. In fact, this is in line with long-term historical averages.
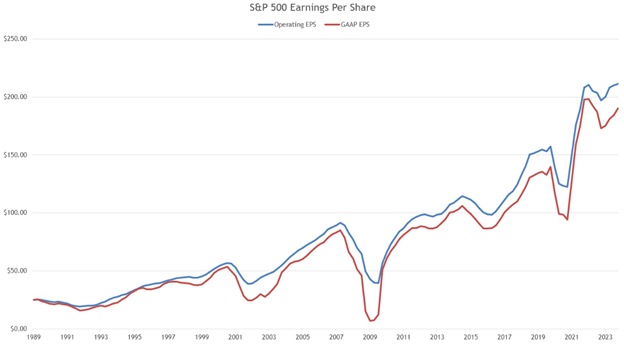
Source: S&P Dow Jones
The rest of the context for our analysis of the drivers of equity returns is what it means for portfolio allocations. With lower-risk fixed-income and alternative investments generating much higher yields and potential returns now in early 2024 than just a few years ago, their appeal is greater now compared to stocks than it has been in a long while. We have to take that into account as we make portfolio allocation decisions. Some final context to the analysis of equity return drivers and how they impact our portfolio decisions (or any research topic for that matter) is to remind everyone that the macroeconomic situation changes both gradually and at times suddenly, and requires a consistent analytical toolkit. We give more weight to factors that can be assessed with higher confidence and over longer timeframes, and with a healthy appreciation for the unforeseeable. These are reasons we don’t typically make big tactical portfolio bets and why we believe diversification is critical to long-term success.