Fourth Quarter 2023 Investment Commentary
Fourth Quarter 2023 Market Recap
What a difference a year makes. In 2022, high inflation and the Fed’s commitment to tame it led to sharply rising interest rates and negative returns for virtually all traditional asset classes. In 2023, much to the surprise of many forecasters, global stock and bond markets ignored widespread expectations that we were headed for a recession and were able to shake off a host of uncertainties to post strong gains for the year.
Aided by a powerful year-end rally, U.S. stocks (S&P 500 Index) jumped nearly 12% in the fourth quarter to finish up 26% for the year, and end within a whisper of its all-time high. Smaller-cap stocks (Russell 2000 Index), which lagged their larger counterparts for most of the year, also rallied sharply in the fourth quarter (+14%) to end the year with a respectable gain of 17%. In an encouraging sign, during the year-end rally we saw a shift in market leadership and equity gains broaden out beyond the “magnificent 7” stocks (Apple, Microsoft, Nvidia, Facebook, Alphabet, Netflix, Amazon) which had been responsible for much of the U.S. equity markets returns prior to the fourth quarter.
Developed International and emerging-market stocks also posted solid gains but weren’t able to keep pace with U.S. markets. Developed International stocks (MSCI EAFE) gained a very respectable 18%, while emerging-market stocks (MSCI EM Index) posted a nearly 10% return.
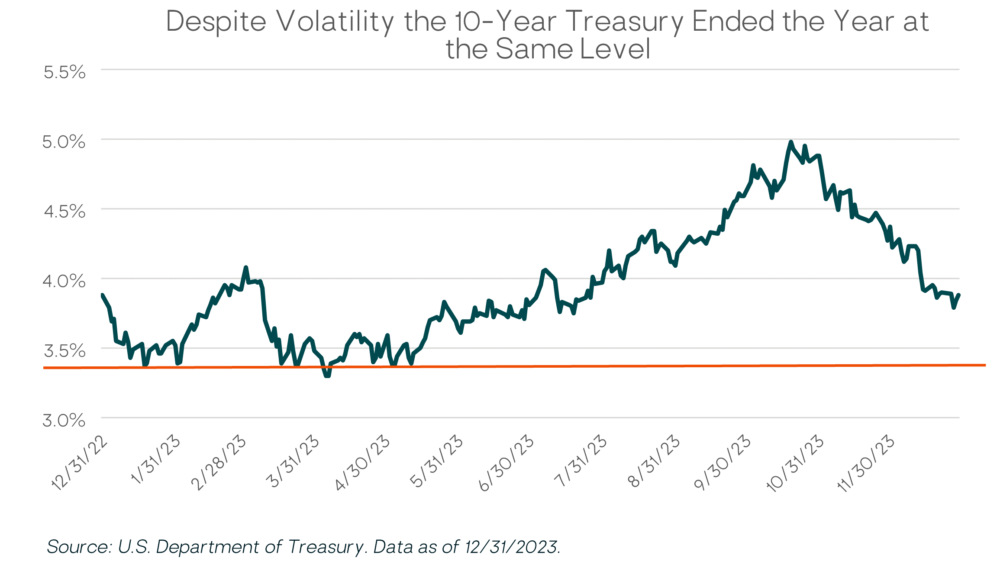
Bonds also rallied sharply in the fourth quarter aided by a significant drop in Treasury yields. The benchmark 10-year Treasury yield declined over 100bps in the fourth quarter resulting in a 6.8% return for the Bloomberg U.S. Aggregate Bond Index. Interestingly, despite massive intra-year volatility, the 10-year Treasury yield ended the year exactly where it started. For the year, U.S. core bonds (Bloomberg U.S. Aggregate Bond Index) finished up 5.5%. Credit was a standout performer both in fourth quarter and for the full year. High-Yield bonds (ICE BofA High Yield Index) were up 7% in the quarter, finishing up 13.4% for the year.
The sharp fourth-quarter rally was driven in large part by Fed policy and falling inflation. The Fed made it clear they believe the end of the war on inflation is near, and not only are they preparing to take their foot off the brake in terms of future rate hikes, but they anticipate interest-rate cuts in 2024.
Portfolio Performance and Key Performance Drivers
For 2023, positive contributors to performance included flexible fixed-income managers as well as active U.S. large cap equity managers. Active emerging-markets managers also, in aggregate, added value last year.
Detractors from performance included trend-following managed futures strategies, which lagged the returns for stocks and bonds during 2023 but had significantly outperformed those markets in 2022.
Macroeconomic and Investment Outlook
Looking ahead to 2024, all eyes will be on the Fed. When will the Fed start to cut interest rates, by how much, and why? With Fed policy top of mind, a key question will be whether the Fed cuts rates because of restrictive policy in the form of high real yields (lower inflation and unchanged Fed Funds) or because economic growth slows more than anticipated. While this question will be in focus, monetary policy is just one of many factors that will influence markets. Geopolitical risk, the U.S. presidential election, labor markets, and inflation will likely fill the headlines and all could be sources of volatility.
In our opinion, a recession is unlikely in the first half of 2024. There are several positives supporting our view including solid economic growth, resilient corporate earnings, declining inflation, and ample liquidity. We think the biggest recession risk will come from weakness among consumers in the latter half of the year and we will continue to closely monitor economic data and adjust our views accordingly.
Inflation
As we stated in our third-quarter commentary, we thought the Fed had the upper hand on inflation and that we would see inflation continue to trend lower. That has been playing out and we continue to believe that inflation will grind lower in the near term. Many of the metrics we observe suggest that inflation is already at or below the Fed’s target. We also continue to monitor the lag effect of monetary policy, i.e., rate hikes take time to flow through the system.
Below is a chart that shows the dramatic surge in money supply (or M2) that occurred because of the pandemic-related stimulus. Money growth tends to lead inflation by 12 to 18 months, and in the chart below we lag the CPI by 12 months to illustrate that inflation is likely to continue to fall in 2024 heading towards the Fed’s 2% target.
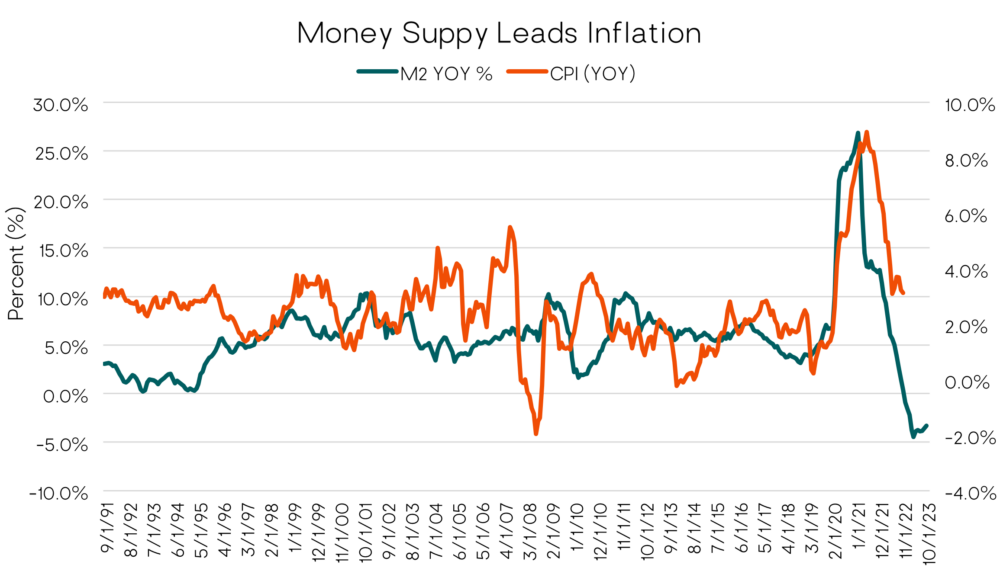
Source: Federal Reserve, U.S. Bureau of Labor Statistics. Data as of 1/11/2023.
The chart below illustrates the year-over-year inflation and year-over-year inflation excluding shelter costs, which is a key CPI input. (It makes up about 30% of the CPI.) While year-over-year inflation recently came in at 3.1%, this number drops to 1.4% when excluding shelter. These levels are not far from or are below the Fed’s goals, which suggests that the Fed’s policy has been working, and with time inflation could continue to fall, particularly if shelter continues to decline.
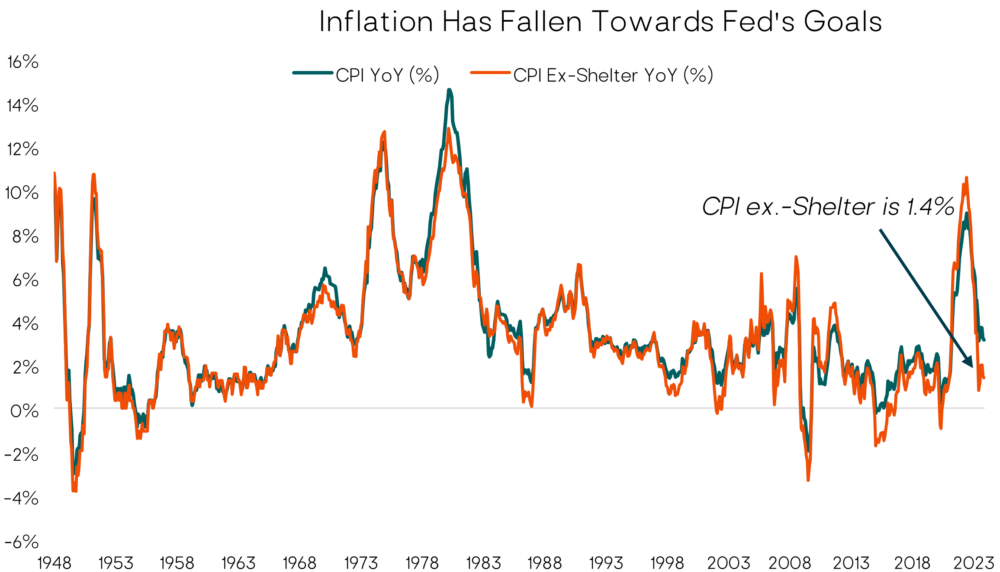
Source: U.S. Bureau of Labor Statistics. Data as of 11/1/2023.
Looking at shelter, below is a chart showing that year-over-year housing prices have historically led inflation, with a lag. In this chart, we lag housing by 12 months. If this relationship holds, this measure suggests that inflation will continue to decline in subsequent months.
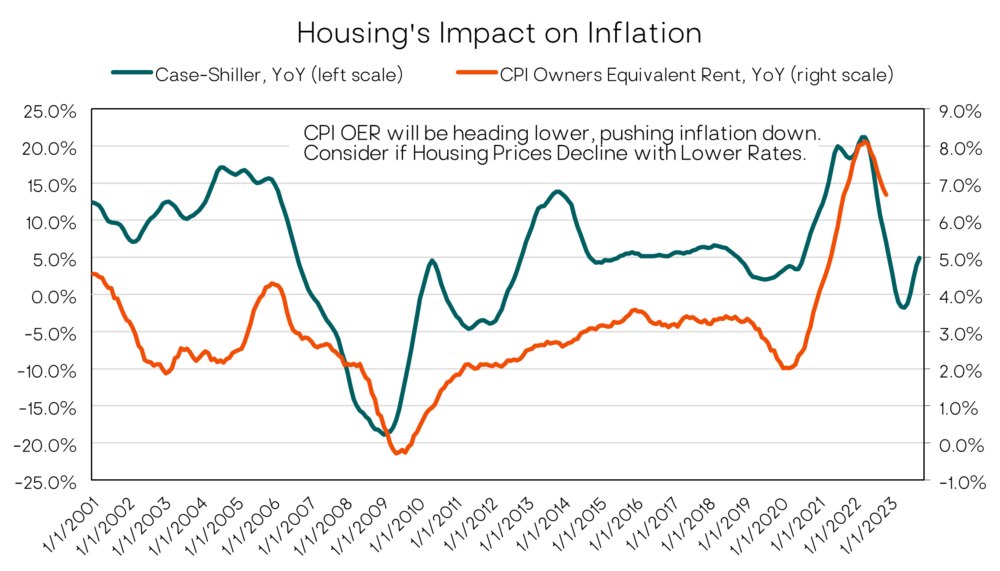
Source: US Bureau of Statistics, Dow Jones. Data as of 11/30/2023.
Another indicator of the direction of consumer inflation is the Producer Price Inflation (PPI). The PPI measures the average change over time in the selling prices received by producers for their output. Therefore, it tracks the wholesale-level price trends for goods and services before they reach consumers. So, a higher PPI could mean that these higher prices get passed on to consumers as some producers pass along increased costs to their buyers. Conversely, consumers may benefit from a shrinking PPI in the form of lower prices. In recent years, supply chain problems and labor shortages have contributed to spikes in the PPI. For example, year-over-year PPI increases for six of the 12 months in 2022 hit double digits. The highest year-over-year jump (11.6%) occurred in March 2022, following Russia’s invasion of Ukraine in February 2022. Much of the year-over-year PPI surge stemmed from higher energy prices tied to the invasion. Currently, the PPI is slightly negative.
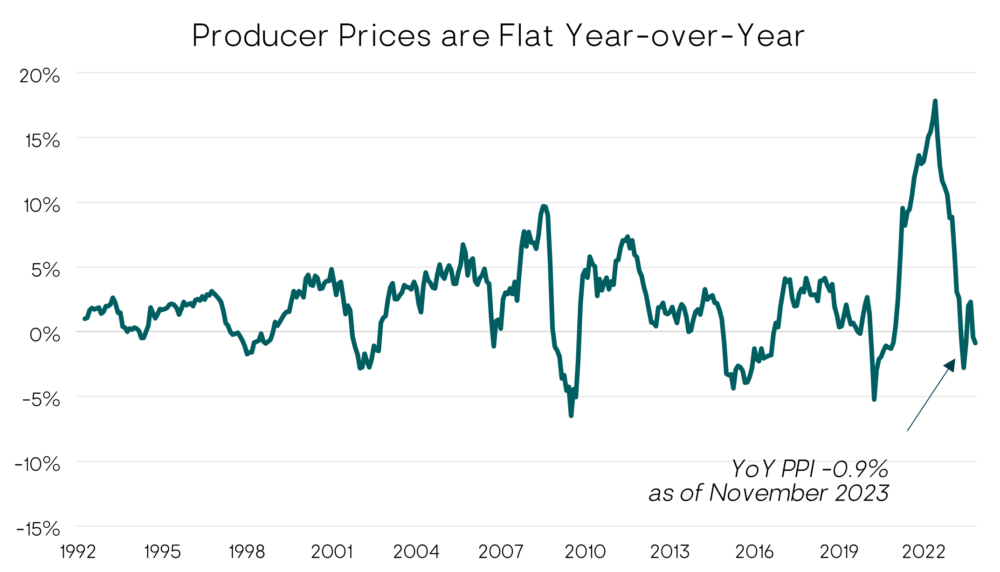
Source: U.S. Bureau of Labor Statistics. Data as of 11/30/2023.
We continue to believe that near-term inflation is under control. We would not be surprised to see inflation temporarily fall below the Fed’s 2% target, although we would not expect it to stay there. Importantly, we know that historically inflation tends to come in waves, so we continue to closely monitor trends in inflation, anticipating a subsequent rise at some point. Of course, factors including the Federal Reserve’s decisions and the government’s use of fiscal policy will play a role in the outlook for inflation.
The Yield Curve
If one were to only look at the Treasury yield curve at the beginning and end of 2023, one might assume that it’s been a quiet year. The chart below shows that Treasury yields for maturities one-year and longer were relatively unchanged when comparing the start and the end of the year. Short-term yields are higher due to Fed rate hikes, while the 10-year Treasury yield finished the year exactly where it started, 3.88%. But throughout the year, there was significant volatility with the 10-year Treasury yield ranging from a low of 3.30% to its high of 4.98%; nearly a 170bps swing.
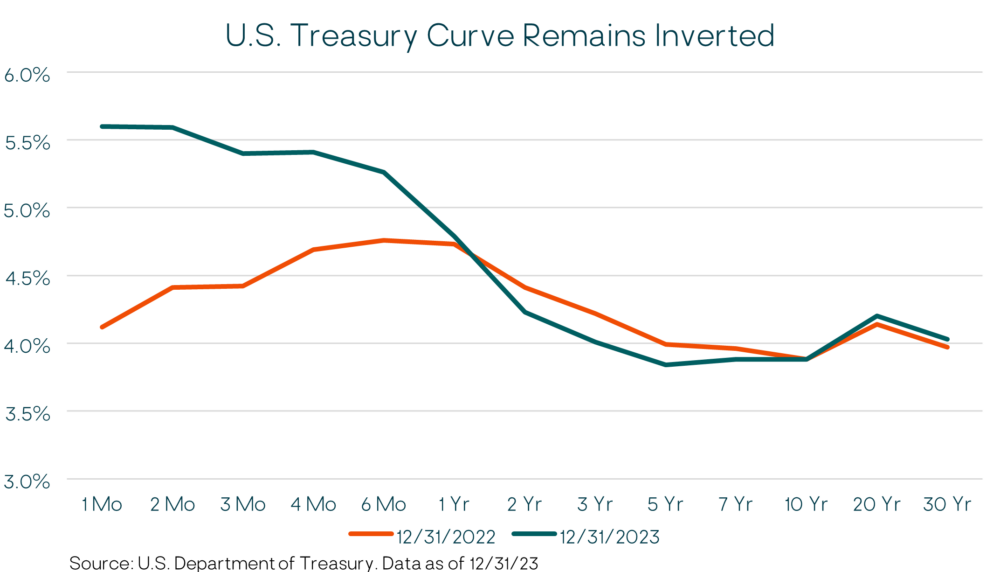
For the entire year, the Treasury yield curve has been inverted, meaning shorter maturity bonds have uncharacteristically higher yields than longer maturities. Many have questioned why the inverted yield curve has yet to successfully predict a recession in this cycle. Afterall, it has historically been a good predictor of recession. We think an inverted curve only tells part of the story.
Another important piece of the story is Fed policy, and whether it is accommodative (leaving rates alone or cutting rates) or restrictive (raising rates). The chart below shows the relationship between the shape of the yield curve, the real Fed Funds rate, and recessions. The green line shows the shape of the Treasury curve, with points above zero indicating a normally sloped yield curve and below zero representing an inverted yield curve. The blue line shows the real Fed Funds Rates, or the upper band of the federal funds rate less inflation. (Here we use the Personal Consumption Expenditures Index, or PCE, the Fed’s preferred inflation metric.) The vertical gray bars indicate a recession.
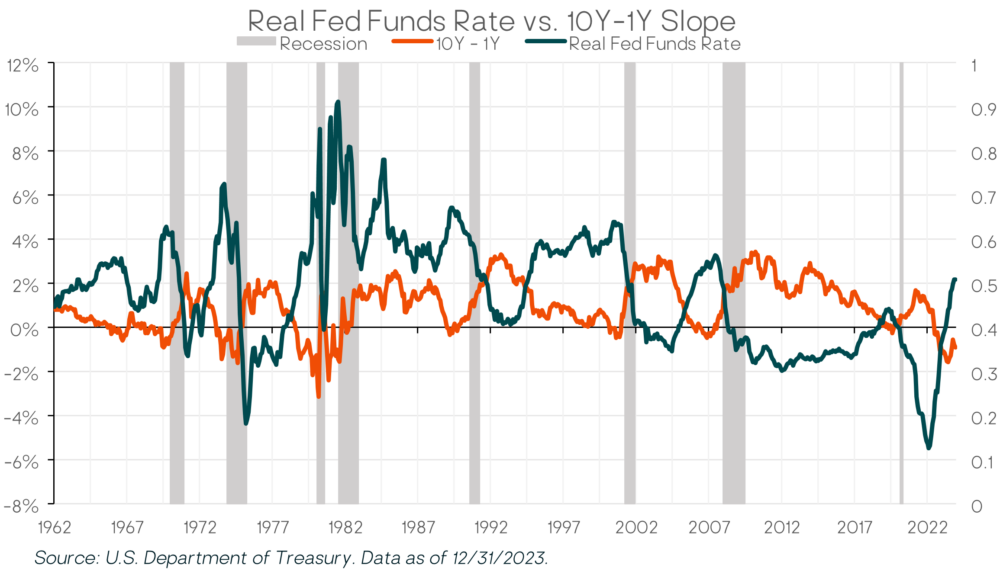
We can see that since the 1960s, an inverted curve and sharply higher real fed funds preceded a recession. In the most recent cycle, however, we can see that while the yield curve has been inverted since July 2022, Fed policy was very accommodative for most of that time, i.e., the real Fed Funds rates were sharply negative when the curve first inverted. It’s only recently been that Fed policy started to move toward restrictive levels. In prior cycles, real Fed Funds proved restrictive at the 3.5% (or higher) level. To the extent that inflation continues declining, and the Fed keeps rates unchanged, Fed policy will become proportionately tighter, which could reach a level that starts to choke the economy. This is one reason that could support the Fed’s decision to cut rates earlier in the year.
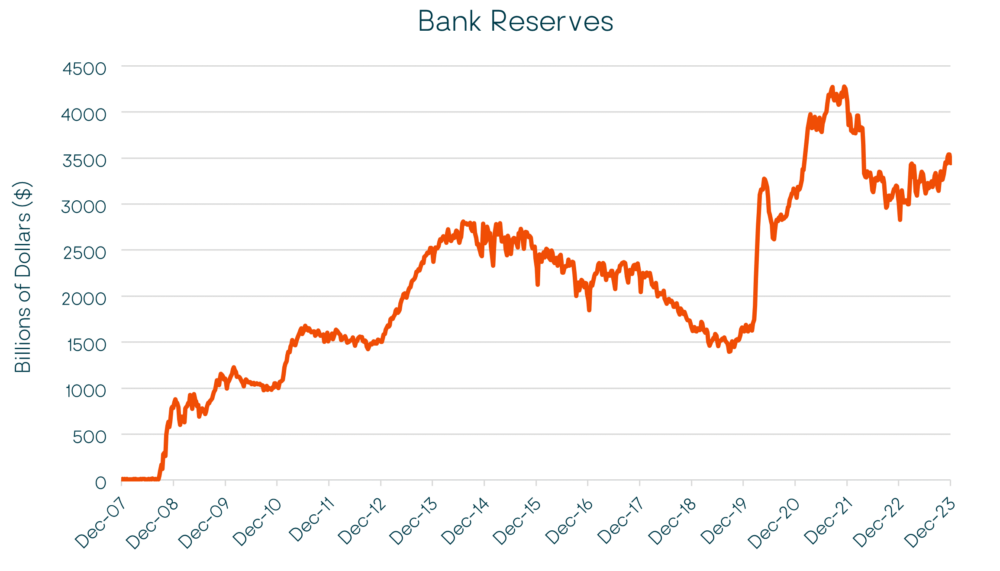
Another part of the story is liquidity, or specifically bank reserves. This is an important point of difference when it comes to this cycle compared to prior cycles when yield curves inverted and Real Fed Funds rates proved too tight. Prior to 2008, the Fed did not pay interest on these reserve accounts. Therefore, banks typically only held what was required to collateralize their deposit base. When banks wanted to expand lending, they were forced to borrow reserves from other banks, which increased short-term interest rates and often helped to tip the economy into recession. However, following the financial crisis in 2008, the Fed has been paying interest on reserves held by banks, which not surprisingly has resulted in historically high levels of bank reserves. The difference today versus the past is that the Fed is not significantly restricting the reserve supply to boost interest rates. The ample supply of reserves suggest that banks can collateralize new lending and that there is significant liquidity in the system during this tightening cycle.
Source: Federal Reserve. Data as of 12/31/2023.
The Road Ahead
Transitions from one economic cycle to the next can be challenging. For example, economic data can present mixed signals, while the timing and magnitude of economic policy and how it flows through to the economy can create uncertainty that leads to volatility. Furthermore, while there are often similarities from cycle to cycle, there are unique aspects to each. Bank reserves, as mentioned above, are one example. Another characteristic of this cycle, which we mentioned in our prior commentary, is the concept of the rolling recession.
Since the Fed started their aggressive tightening cycle, the debate has been about the odds of a “hard landing,” “soft landing,” or “no landing” for the economy. The National Bureau of Economic Research (NBER) is the scorekeeper when it comes to determining recessions. Their definition of a recession is a “significant decline in economic activity that is spread across the economy and that lasts more than a few months.” The business cycle since the onset of the pandemic has been anything but ordinary. Instead of a simultaneous and broad-based decline in economic activity, we’ve observed industries face isolated declines over time, while the board economy has managed to stay afloat.
Throughout 2020, Covid had an unprecedented impact on societies around the world. Many non-essential service-oriented businesses such as air travel and tourism experienced a depression-like scenario as demand evaporated. Conversely, goods-related businesses experienced a boom. Officially, there was an NBER-defined recession in 2020 that lasted from February 2020 to April 2020. Then through 2021 and 2022, consumer habits flipped and demand for services surged as economies around the world re-opened. As inflation took hold and interest rate increases became inevitable, rate-sensitive areas of the economy contracted. The housing market froze and a higher cost of capital for technology firms caused funding to dry up and there were layoffs across the sector. In 2023, we have seen regional banks and commercial real estate face declines.
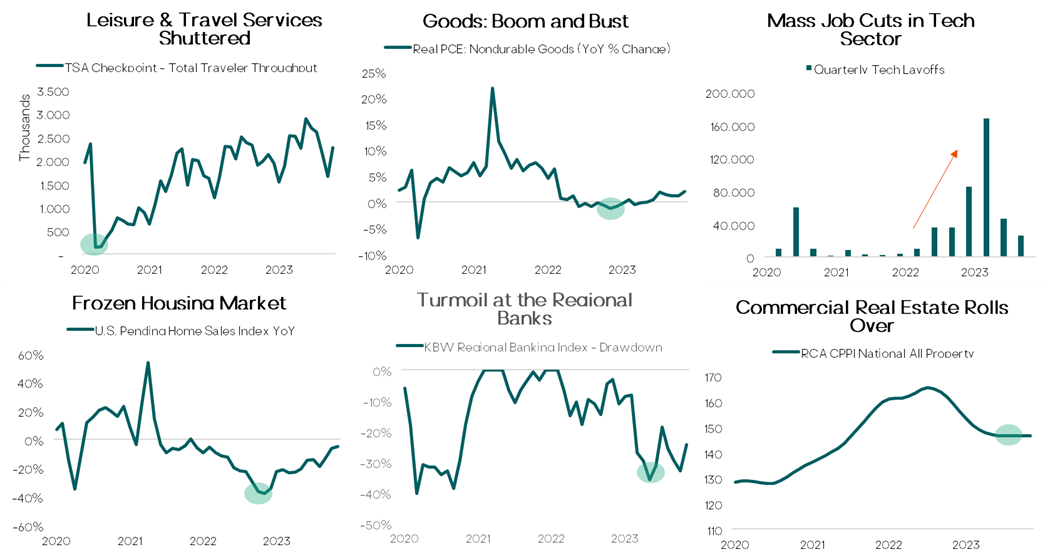
Source: Bloomberg, Federal Reserve. Data as of 12/31/2023.
With various sectors of the economy experiencing contractions at different times over the last few years, we would anticipate more of a mild slowdown, not a deep economic downturn. But of course, we will be closely monitoring corporate earnings, labor statistics, and financial conditions to best assess the ultimate type of “landing.” There is growing consensus that a “soft landing” may occur in the U.S. in 2024, and we are not ruling that out, especially if the Fed cuts rates sooner than later. That said, we recognize that soft landings are quite uncommon, occurring only four times in the last 75 years.
Indeed, the most anticipated recession ever has yet to happen. Many economists now expect it to happen in the second half of this year. Accordingly, the market has gained confidence that interest rates have peaked, and it has been bringing forward the expected timing of rate cuts in hopes of the Fed avoiding a recession. As of year-end, the market’s expectations are for the Fed to lower rates beginning in March and/or May. And by the end of 2024, the expectation is for rates to be in the 3.50-4.00% range, or 150-200bps lower than current levels. We note that the path of Fed hikes commonly resembles an escalator on the way up, but an elevator on the way down, meaning the Fed slowly staircases rate hikes on the way up, but waits too long to cut rates creating an economic slowdown and the need to drop rates swiftly and meaningfully to avoid a deep recession.
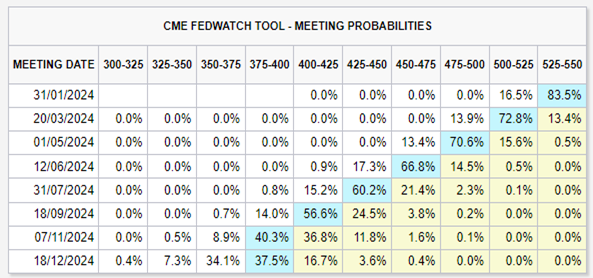
Source: Federal Reserve. Data as of 12/31/2023.
Equity Markets
In November, the Fed made it clear they believe the end of the war on inflation is near, and not only are they preparing to take their foot off the brake, they are anticipating interest-rate cuts in 2024. At the same time, the Fed also said it foresees the economy remaining relatively healthy with steady growth and modest levels of unemployment. Historically, the end of the Fed’s hiking cycle usually serves as a tailwind for stocks.
Within the U.S. market, performance in 2023 was driven by the handful of mega-cap growth stocks (dubbed the “Magnificent Seven”) and the concentration in these names at the top of the index remains at historic levels. These stocks had an average return in-excess of 100% for 2023 and now represent a combined weight of more than 28% in the S&P 500 and 47% in the Russell 1000 Growth Index.
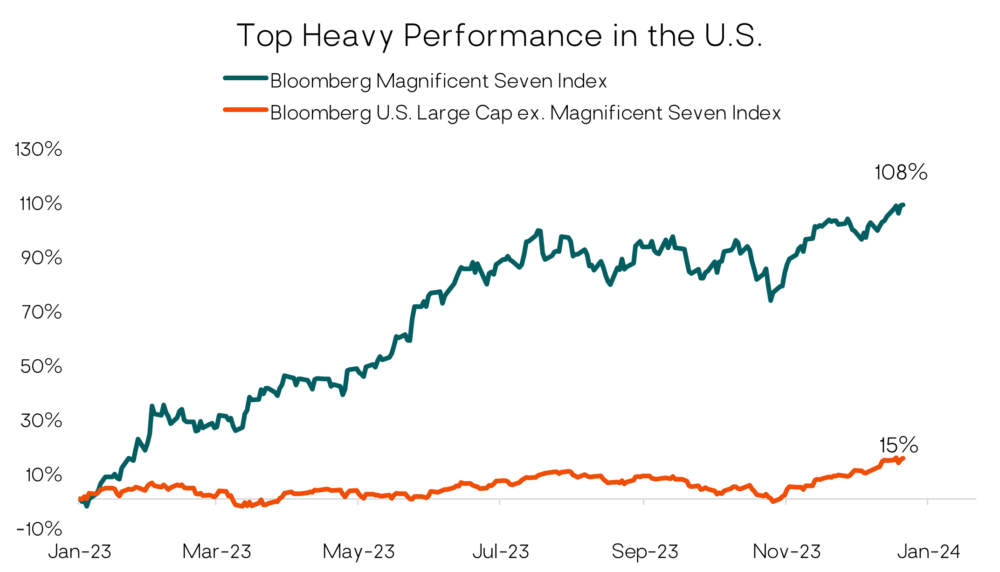
With the market confident that interest rates have reached their cyclical peak, we also saw a shift in market leadership with equity gains broadening out beyond the “magnificent seven.” As seen in the chart above, the remaining 493 stocks in the index rallied 15% to end the year. We believe the recent broadening out of equity performance has the potential to persist over the course of 2024, and we could see areas of the market that have significantly lagged perform much better. For example, small-cap stocks beat large-cap stocks and value stocks outperformed growth stocks late in the year. We anticipate rebalancing portfolios away from the big winners of 2023 and towards higher-quality, more attractively valued strategies that could perform well in periods of heightened volatility.
Our overall equity allocation continues to favor another unloved part of the market – developed international and emerging-market stocks. While much of the talk is about continued U.S. outperformance, the average international stock outperformed the average U.S. stock last year. The MSCI EAFE Equal-Weighted Index bested the S&P 500 Equal-Weighted Index last year—gaining 16.3% versus 13.9%, respectively. This adds to the outperformance that started when U.S. markets bottomed in mid-October 2022. Since then, the average international stock is up 37% compared to a 26% cumulative return for the average U.S. stock. A more than 10% decline in the U.S. dollar over the same period has been a tailwind for international stocks.
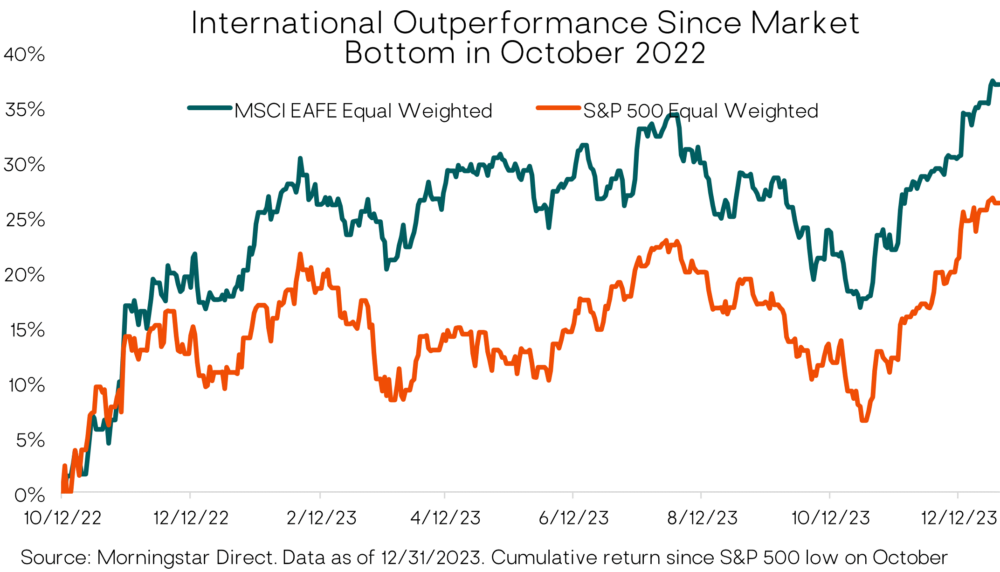
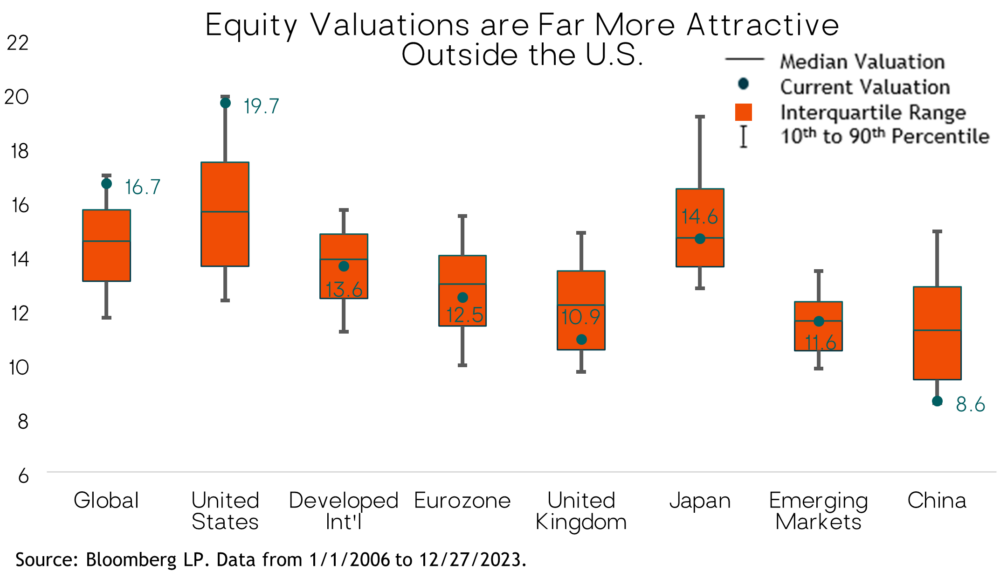
Heading into 2024, the valuation discount for developed international and emerging-market stocks versus the U.S. is the widest it’s been in decades. From 2006 through 2016, the U.S. and developed markets traded within one multiple point of each other. The average forward P/E for the S&P 500 over the period was 14x compared to 13x for MSCI EAFE. Since 2016, the valuation gap has widened substantially. The S&P 500 now trades at nearly 20x forward earnings while the MSCI EAFE remains close to 13x. The story can be seen in the chart below—U.S. stocks trade toward the top end of their valuation range while other regions offer up better relative values. Most other markets are trading roughly in-line or slightly below their historic averages. All else equal, lower starting valuations imply better long-term returns and provide more of a valuation cushion should multiples contract in a stock market sell-off.
Earnings in the U.S. have largely recovered from their lull in 2022. Low double-digit earnings growth is the current consensus expectation for the S&P 500 in 2024. With revenue growth estimates for 2024 currently at 5.5%, the expectation is for profit margins to expand back towards all-time highs. While margin expansion can’t be fully ruled out, we think it’s unlikely they’ll reach peak levels because we don’t believe companies will benefit from the same level of pricing power as they did in 2021 and 2022. Moreover, with interest costs having risen substantially over the past year, it would be a headwind to any company needing to refinance or take on new/additional debt.
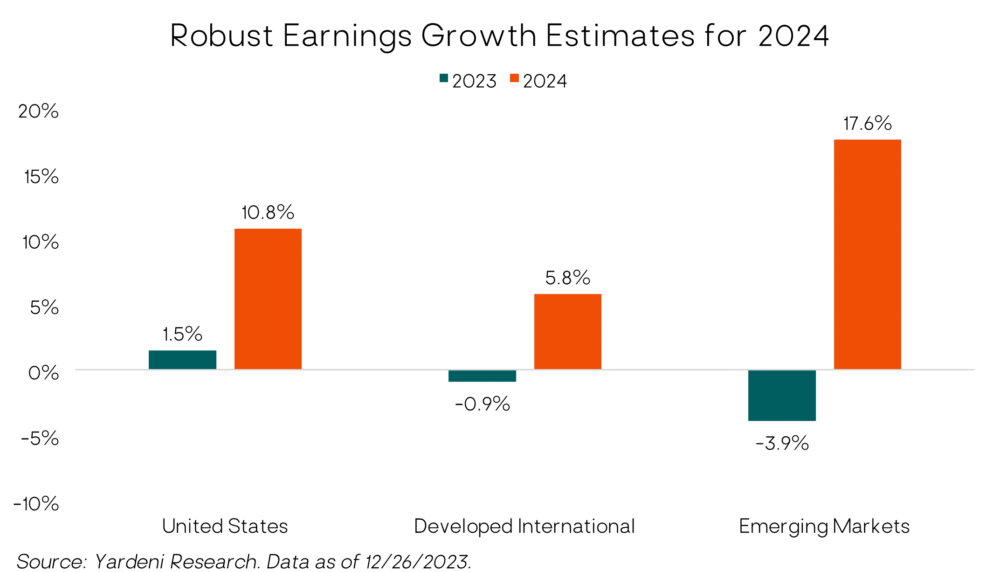
Emerging-markets stocks have the highest earnings growth expectations for 2024 at over 17%. However, emerging-markets earnings have yet to recover following their contraction in 2022—and remain about 16% below their peak level (in local currency terms). The main culprit for the suppressed earnings picture is China. A strong earnings recovery was expected following the removal of their zero-COVID policy in late 2022. But after an initial bounce in early 2023, earnings in China have not moved meaningfully higher. While the Chinese economy has stabilized in the second half of 2023, it has not recovered like many had expected. The COVID reopening playbook that worked for investors in the U.S. and Europe did not provide the proper roadmap for Chinese equities.
While there hasn’t been a complete meltdown of the Chinese economy, it has certainly underperformed expectations. The problems facing China are well documented at this point—a struggling real estate sector, a regulatory crackdown on the tech sector, deteriorating demographics, and heightened geopolitical tensions (to name a few). Economic optimism in China has taken a significant hit and Chinese consumer confidence is depressed (see chart). Equity valuations are close to their lows at 8x forward earnings and investors broadly hold a pessimistic outlook—both of which set the table for positive surprises on incrementally better news. It’s worth remembering that stock markets don’t bottom on good news. The turn comes when news is “less bad” than expected.
Fixed-Income
Looking to 2024, inflation and Fed policy will continue to be major drivers of bond market returns. The question now is how to position for the peak in interest rates. We know that forecasting the timing and magnitude of rates cuts is difficult, and relying on accurate projections for the purposes of asset allocation can be unreliable. If we rewind the clock two years to the end of 2021, rates were 0% and the market forecasted three 0.25% (quarter-point) hikes. Instead, there were effectively 17 quarter-point hikes. The market got it wrong again in 2022, when two or three quarter-point hikes were expected to be followed by two rate cuts. There were four hikes, and no cuts. Now the market is anticipating a handful of cuts in 2024, which could help to avoid a recession and guide the economy in for a soft landing.
We don’t know exactly when or by how much the Fed will cut, but we think the Fed has done its job. Most of the what the Fed can control through higher rates has happened: short-term rates have increased, real rates have increased, lending has slowed meaningfully, mortgage rates jumped causing the housing market to stall, and commodities have declined. Meanwhile, money supply continues to decrease, and the Fed continues to reduce its balance sheet. And as we have mentioned, there are still questions about the lag effects of monetary policy and if there are still negative impacts to be felt.
Looking ahead, we think the Fed will cut rates (perhaps meaningfully) and we will finally get back toward a normal shaped yield curve, with the front end of the curve declining more than the long end. Our thinking is based on our views of near-term inflation grinding lower, Fed policy becoming too restrictive, deteriorating trends in the consumer, and comments from policymakers.
For now, investors can continue to benefit from today’s higher short-term yields and an inverted yield curve. We also continue to maintain exposure to the longer-end of the curve with core bonds. The Bloomberg U.S. Aggregate Bond Index is currently yielding 4.5%, which is above the current 3.1% inflation level. So, bonds finally provide a positive real (after-inflation) yield. We also continue to hold core bonds as a ballast to balanced portfolios, as we believe they will likely provide some downside protection in the event of a recession or market decline due to an exogenous event. Importantly, the core bond exposure we do hold generates higher yields than the core bond index (without additional interest-rate risk) allowing us to add incremental value to portfolios.
We remain positive on corporate bonds. Overall, credit fundamentals remain relatively healthy despite higher debt costs. Interest coverage, the level of leverage, and cash levels all look better than in historical periods late into a rate cycle.
In addition to core bonds, we continue to have meaningful exposure to higher-yielding, actively managed, flexible bond funds run by experienced teams with broad opportunity sets. There are several fixed-income sectors outside of the traditional parts of the bond market that provide attractive risk-return potential, and we access them through active managers. Some of these funds are currently yielding in the high single digits, while maintaining an eye on capital preservation. In fact, some of our bond holdings have incrementally become defensive through the year.
Alternatives
Finally, we maintain core positions (for example, approximately 5% in a typical balanced portfolio) in trend-following managed futures funds. Managed futures returns were very strong in 2022 while traditional stock and bond investments fell double digits. This year was more of a rollercoaster, with disappointing first-quarter and fourth-quarter performance bookending the year, ultimately overshadowing a strong middle of the year.
We remain confident in trend-following managed futures’ powerful long-term portfolio benefits in providing alternative and non-correlated returns relative to traditional stock and bond holdings. Trend following strategies are also much less dependent than traditional investments on any particular macro environment. That is, they can perform well whether the macro backdrop is deflationary, recessionary, inflationary, or growth-oriented.
In Closing
We think it is quite possible that 2024 will be a year where investors again enjoy some of the classic underpinnings of investing, where stocks and bonds are less correlated and provide diversification benefits to portfolios. This was not the case in 2022 and 2023, when stocks and bonds both declined meaningfully and then posted gains. Less correlation would be welcomed, as we anticipate an overall choppy market environment given headline risks related to the economy, Fed policy, geopolitical events, and the presidential election (election years have historically been more volatile for the equity markets).
While there are likely to be bouts of volatility, these inevitably create opportunities. Currently, we see opportunities within the stock market, particularly as we expect a broadening out into areas of the market that have lagged. We also think this could be a favorable environment for bottom-up investors in that fundamentals may matter more in an uncertain environment, and picking opportunities may be more important than simply buying broad index exposure to the market. Within fixed-income, we believe that rates have peaked, inflation is under control for now, and that interest rates will decline though not back to zero. In this environment we continue to take advantage of the inverted yield curve, capturing higher yields from shorter-term maturities, while also benefiting from more attractive yields across the bond market. We will also look for any opportunities that arise as a result of the Fed not meeting market expectations around the timing and magnitude of rate cuts.
As we enter 2024, we extend our gratitude for your continued trust and confidence. We wish you and your loved ones peace, happiness, and good health in the new year.
– Litman Gregory Wealth Management
Important Disclosure
This report is solely for informational purposes and shall not constitute an offer to sell or the solicitation to buy securities. The opinions expressed herein represent the current views of the author(s) at the time of publication and are provided for limited purposes, are not definitive investment advice, and should not be relied on as such.
The information presented in this report has been developed internally and/or obtained from sources believed to be reliable; however, Litman Gregory Wealth Management, LLC (“Litman Gregory” or “LGWM”) does not guarantee the accuracy, adequacy or completeness of such information. Predictions, opinions, and other information contained in this article are subject to change continually and without notice of any kind and may no longer be true after the date indicated.
Any forward-looking statements speak only as of the date they are made, and LGWM assumes no duty to and does not undertake to update forward-looking statements. Forward-looking statements are subject to numerous assumptions, risks and uncertainties, which change over time. Actual results could differ materially from those anticipated in forward-looking statements.
In particular, target returns are based on LGWM’s historical data regarding asset class and strategy. There is no guarantee that targeted returns will be realized or achieved or that an investment strategy will be successful. Target returns and/or projected returns are hypothetical in nature and are shown for illustrative, informational purposes only. This material is not intended to forecast or predict future events, but rather to indicate the investment returns Litman Gregory has observed in the market generally. It does not reflect the actual or expected returns of any specific investment strategy and does not guarantee future results. Litman Gregory considers a number of factors, including, for example, observed and historical market returns relevant to the applicable investments, projected cash flows, projected future valuations of target assets and businesses, relevant other market dynamics (including interest rate and currency markets), anticipated contingencies, and regulatory issues. Certain of the assumptions have been made for modeling purposes and are unlikely to be realized. No representation or warranty is made as to the reasonableness of the assumptions made or that all assumptions used in calculating the target returns and/or projected returns have been stated or fully considered. Changes in the assumptions may have a material impact on the target returns and/or projected returns presented.
A list of all recommendations made by LGWM within the immediately preceding one year is available upon request at no charge. For additional information about LGWM, please consult the Firm’s Form ADV disclosure documents, the most recent versions of which are available on the SEC’s Investment Adviser Public Disclosure website (adviserinfo.sec.gov) and may otherwise be made available upon written request to [email protected]
LGWM is an SEC registered investment adviser with its principal place of business in the state of California. LGWM and its representatives are in compliance with the current registration and notice filing requirements imposed upon registered investment advisers by those states in which LGWM maintains clients. LGWM may only transact business in those states in which it is noticed filed or qualifies for an exemption or exclusion from notice filing requirements. Any subsequent, direct communication by LGWM with a prospective client shall be conducted by a representative that is either registered or qualifies for an exemption or exclusion from registration in the state where the prospective client resides.
Index Disclosure
Any reference to a market index is included for illustrative purposes only, as it is not possible to directly invest in an index. Indices are unmanaged, hypothetical vehicles that serve as market indicators and do not account for the deduction of management fees or transaction costs generally associated with investable products, which otherwise have the effect of reducing the performance of an actual investment portfolio.
The Standard & Poor’s 500 Composite Stock Price Index is a capitalization-weighted index of 500 stocks intended to be a representative sample of leading companies in leading industries within the U.S. economy. Stocks in the Index are chosen for market size, liquidity, and industry group representation.
The Russell 2000 Index measures the performance of the small-cap segment of the US equity universe. The Russell 2000 Index is a subset of the Russell 3000® Index representing approximately 7% of the total market capitalization of that index, as of the most recent reconstitution. It includes approximately 2,000 of the smallest securities based on a combination of their market cap and current index membership.
The MSCI ACWI Index represents the performance of large- and mid-cap stocks across 23 developed and 24 emerging markets. The index covers 2,900 constituents across 11 sectors and approximately 85% of the free float-adjusted market capitalization in each market.
The MSCI EAFE Index is an equity index which captures large and mid-cap representation across 21 Developed Markets countries* around the world, excluding the US and Canada. With 799 constituents, the index covers approximately 85% of the free float- adjusted market capitalization in each country.
The MSCI Emerging Markets Index is a free float-adjusted market capitalization index that is designed to measure equity market performance of emerging markets. The MSCI Emerging Markets Index consists of the following 23 emerging market country indexes: Brazil, Chile, China, Colombia, Czech Republic, Egypt, Greece, Hungary, India, Indonesia, Korea, Malaysia, Mexico, Peru, Philippines, Poland, Qatar, Russia, South Africa, Taiwan, Thailand, Turkey and the United Arab Emirates.
The Bloomberg U.S. Aggregate Bond Index is a broad-based benchmark that measures the investment grade, U.S. dollar- denominated, fixed-rate taxable bond market.
The US High-Yield Market Index is a US Dollar-denominated index which measures the performance of high-yield debt issued by corporations domiciled in the US or Canada.
The ICE BofA US High Yield Index is market capitalization weighted and is designed to measure the performance of U.S. dollar denominated below investment grade (commonly referred to as “junk”) corporate debt publicly issued in the U.S. domestic market.
The ICE U.S. Dollar Index is a geometrically-averaged calculation of six currencies weighted against the U.S. dollar.
The S&P/LSTA Leveraged Loan 100 Index (LL100) dates back to 2002 and is a daily tradable index for the U.S. market that seeks to mirror the market-weighted performance of the largest institutional leveraged loans, as determined by criteria. Its ticker on Bloomberg is SPBDLLB.
The MSCI Hedged Indexes include all of the securities and weights of each corresponding unhedged MSCI Parent Index, enabling investors to measure the impact of hedging currency, for all the constituents of the Parent Index.
MSCI World ex USA Index: captures large and mid cap representation across 22 of 23 Developed Markets (DM) countries*–excluding the United States. With 871 constituents, the index covers approximately 85% of the free float-adjusted market capitalization in each country.
Estimated Returns Disclosure
Scenario Definitions:
Downside: The economy falls into a deep and sustained recession for any of various reasons, such as deleveraging/deflation, unexpected systemic shock, geopolitical conflict, Fed or fiscal policy error, etc. At the end of our five-year tactical horizon, S&P 500 earnings are below their normalized trend and valuation multiples are below-average reflecting investor risk aversion. Inflation and 10-year Treasury nominal and real yields are very depressed.
Base: Consistent with long-term economic and market history, reflecting economic and earnings growth cycles that are interspersed with recessions around an upward sloping normalized growth trendline. Inflation is at or moderately higher than the Fed’s 2% target level and 10-year Treasury real yields are around zero percent to slightly positive. For the S&P 500, we now bookend our base case with a lower-end and upper-end estimate:
-
At the lower end of our base-case fair-value range, reflation efforts are successful and nominal economic growth is higher than the average. However, the economy overheats, and valuation multiple and some margin compression largely offset the favorable macro backdrop.
-
At the upper end, reflation efforts are also successful, nominal economic growth is higher than observed since the 2008 financial crisis on average, profit margins move slightly higher, and valuation multiples are also slightly higher than the recent historical average.
